If you are a CEO, founder, CRO or revenue leader at a growing B2B company, this guide is for you. Revenue intelligence is the practice of turning the data your sales, marketing and customer success teams already create into decisions you can trust about pipeline, forecasts and where to spend next. Our guide to customer analytics covers this in more detail.
You will get a plain definition, the data foundations it needs, the metrics that matter, how attribution, dashboards, forecasting and AI fit in, and the governance and operating rhythm that keep it working. Each section links to a deeper guide on its sub-topic. Our guide to multi touch attribution covers this in more detail.
|
Revenue Intelligence Revenue intelligence is the practice of unifying sales, marketing and customer data so revenue teams can see pipeline health, understand why deals move, and forecast and act with evidence instead of opinion. Our guide to sales analytics covers this in more detail. |
Revenue intelligence turns scattered revenue data into actionable insights
Most growing companies do not lack data. They lack agreement about what it says. Pipeline sits in the CRM, campaign results sit in a marketing tool, call recordings sit somewhere else, and renewals sit in a spreadsheet. Each leader brings a different number to the same meeting.
Revenue intelligence closes that gap. It collects revenue related data from every system that touches a buyer, cleans and connects it, and turns it into actionable insights for the people who have to decide. A revenue leader sees where the quarter stands. A sales rep sees which deal needs attention first. Our guide to sales dashboard covers this in more detail.
Revenue intelligence creates one shared picture of the sales pipeline, so sales leaders and sales managers argue about decisions instead of about whose number is right. Our guide to revenue analytics covers this in more detail.
Gartner describes the category in its July 2024 abstract of the Market Guide for Revenue Intelligence. It says revenue intelligence platforms "enhance sales productivity by capturing seller activity, measuring pipeline health and guiding sellers' next steps."
That sentence holds three jobs worth remembering: capture, measure and guide. Capture means the system records what sales teams and buyers actually do, from sales activities to sales conversations. Measure means it turns those records into reliable numbers. Guide means it points a person to the next step.
The same data also shows sales trends over time, such as a drift in sales cycle length or average deal size, and the market trends and customer behavior behind them.
How revenue intelligence works
The mechanics are the same whether you use a dedicated platform or build the capability yourself on a CRM and a reporting layer. Four steps repeat in every setup.
First, data is collected from revenue systems: the CRM, email and calendar activity, marketing automation, billing and customer success records. Second, that data is unified so one buyer is one record, which means breaking down the data silos where each tool holds its own version of the buyer.
Third, the work is analyzed: stage movement, activity, engagement and outcomes. Fourth, people act on what the analysis shows.
The fourth step is the one most companies skip. An insight that never reaches a weekly meeting or a seller's task list changes nothing. Later sections show how to build the review rhythm that closes this loop.
Revenue intelligence compared with the terms next to it
Four neighbors cause confusion, so a short comparison helps.
Sales intelligence is information about prospects: who they are, what they do and whether they fit. Business intelligence is broad reporting across the whole company, from finance to operations. Conversation intelligence analyzes what is said on sales calls. Revenue operations is the team and discipline that owns the process and systems behind revenue, and it works closely with sales operations. Our guide to ltv to cac ratio covers this in more detail.
Revenue intelligence sits across them. It uses sales intelligence and conversation data as inputs, borrows the reporting methods of business intelligence, and is usually owned by the revenue operations function. It is the decision layer on top of the data, not another source of data.
A word on the second meaning of the phrase. Some pages use "revenue intelligence" for software that tracks a company's own billing and recognized revenue for finance teams. This guide covers the go-to-market meaning: pipeline, conversion and growth across the buyer journey.
Revenue intelligence is only as good as the data underneath it
Every promise of revenue intelligence depends on data that people trust. If the CRM holds duplicate accounts, missing close dates and stage updates made a week late, a clever dashboard will only display the mess faster.
The trust problem is measurable. Salesforce's 2024 State of Sales survey of 5,500 sales professionals, published on July 25, 2024, found that "Only 35% of sales professionals completely trust the accuracy of their organization's data."
Salesforce's 2026 State of Sales report, published on February 3, 2026 from a survey of 4,050 sales professionals, adds that 74% of sales professionals are focusing on data cleansing. It also found that 79% of high performers prioritize data hygiene, compared with only 54% of underperformers.
Manual data entry is slow and error-prone, and incomplete records lead to poor decisions. Automated CRM hygiene, such as merging duplicates and flagging empty fields, keeps decisions anchored to clean, current data.
Gartner reached a similar finding from the analytics side. Its February 2024 sales analytics survey of 303 sales leaders found that poor data quality (44% of respondents) and limited cross-functional collaboration (44%) were among the top three barriers to analytics success.
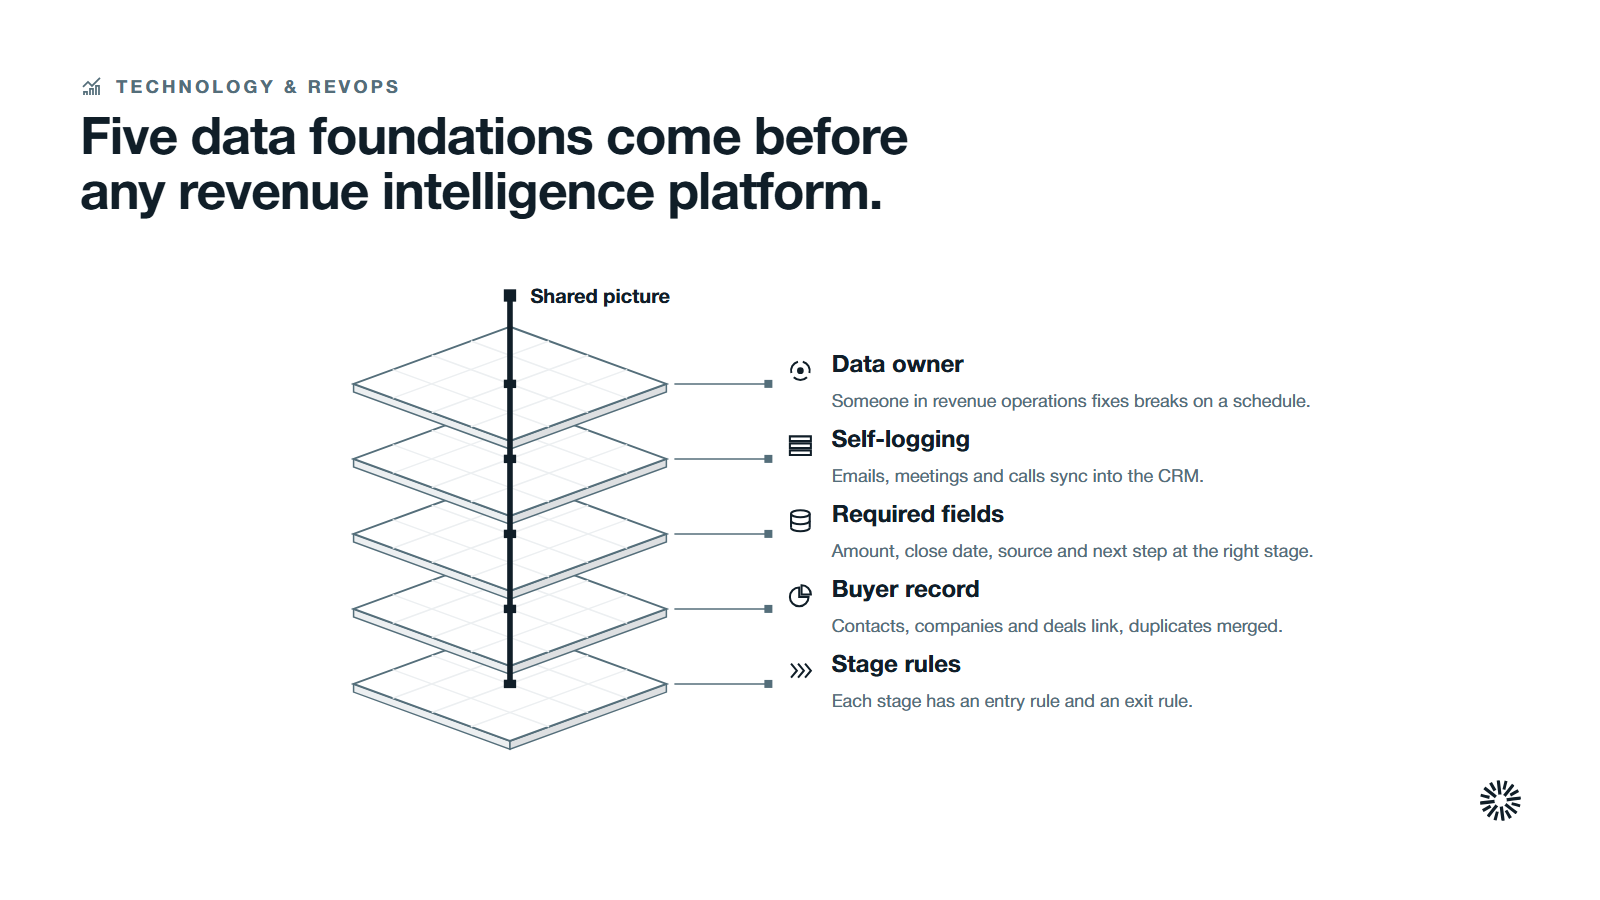
Build five data foundations before you buy anything
Treat these as the entry ticket, and write your sales process down first so every item below has something to attach to. A revenue intelligence platform can help with several of them, but it cannot invent decisions your team has not made. Our guide to revenue intelligence platform covers this in more detail.
- One definition of each stage. Every deal stage needs an entry rule and an exit rule, so a deal in "proposal" means the same thing for every rep. Our guide to sales pipeline stages shows how to write them.
- One record per buyer. Contacts, companies and deals must link correctly, with duplicates merged and owners assigned.
- Required fields that are really required. Amount, close date, source and next step should be captured at the right stage, not reconstructed at quarter end.
- Activity that records itself. Emails, meetings and calls should sync data into the CRM automatically so reps do not log by hand.
- A named owner for data quality. Someone in revenue operations should own the checks and fix breaks on a schedule.
Our deeper guide to CRM data quality covers the checks, the owners and the routine. Start there if your team doubts the numbers it sees.
Connect customer data, not only sales data
Pipeline is one view of revenue. Customer data completes it. Support history, product usage, renewal dates and customer feedback show whether the revenue you win is the revenue you keep.
Customer behavior and customer engagement, from product usage to support requests, belong in the same model, and expansion deals in existing accounts need the same care as new business.
Together they can point to growth opportunities, because customer behavior and market trends show where demand is building. A unified data model lets customer success see the original sales context, and lets sales see how a customer actually behaves after the signature.
Make this connection early. Retrofitting it after dashboards are built means rebuilding the dashboards. Our guide to marketing data analytics covers the marketing side of the same data.
The important revenue intelligence metrics start with pipeline, velocity and win rate
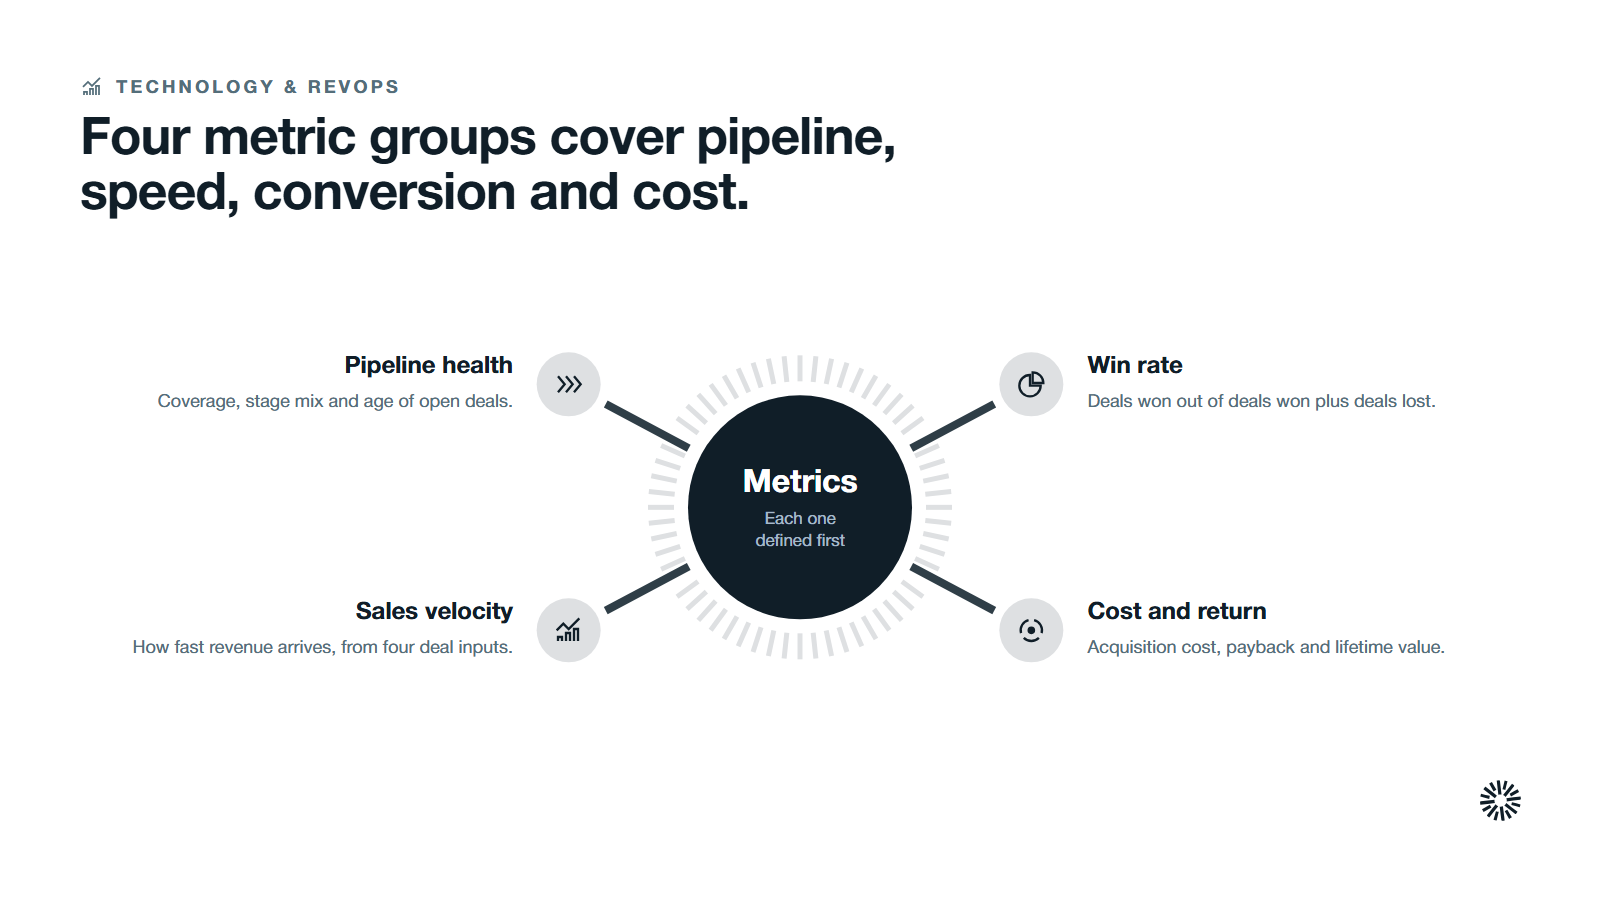
A short list of metrics beats a long one. Revenue metrics earn their place when they explain sales performance and revenue outcomes. The important revenue intelligence metrics describe four things: how much pipeline you have, how fast it moves, how often it converts and what it costs to produce.
Our guide to the top revenue operations metrics to track gives the wider menu.
For each metric below, write down the formula, the source field and the owner before you chart it. A metric without a written definition will be argued about instead of used.
Pipeline health: coverage, stage mix and age
Pipeline health asks whether you have enough opportunities, in the right stages, young enough to close. Three views answer it.
Pipeline coverage compares open pipeline with the target for the period. Stage mix shows how the pipeline is spread across early and late stages. Pipeline age shows how long deals have sat in a stage. Our guide to pipeline coverage explains how to set the ratio for your own history instead of copying someone else's.
The same review flags deals at risk of slipping, such as a deal with no recent buyer reply, no next step or a missing decision-maker. Engagement signals help reps prioritize accounts.
Sales velocity ties four deal metrics together
Sales velocity combines the deal metrics that govern how fast revenue arrives. The common formula multiplies the number of qualified opportunities, average deal size and win rate, then divides by sales cycle length. Our guide to win rate covers this in more detail.
For illustration only: if a team works 40 opportunities, with an average deal size of 20,000, a win rate of 25% and a sales cycle length of 100 days, the result is 40 times 20,000 times 0.25 divided by 100, or 2,000 of revenue per day. The numbers are invented to show the arithmetic.
The value of the formula is diagnostic. Each input is a lever, and the formula shows which lever moved when velocity changed. Read our guide to sales velocity and GTM engineering metrics for how to use it in practice.
Win rate needs a stated denominator
Win rate is deals won divided by deals won plus deals lost, for a defined cohort and period. The trap is the denominator. If you count every opportunity ever created, including those still open, the rate drifts for reasons unrelated to selling.
Calculate win rate by segment and by source, not only in total. A company-wide figure can hide the fact that one segment converts at twice the rate of another, which changes where sales teams should spend their time.
Cost and return: CAC, payback and lifetime value
Customer acquisition cost is the sales and marketing spend to win a customer divided by the number of customers won. Payback is the time it takes for a customer's gross margin to repay that cost. Lifetime value estimates the margin a customer produces over the relationship.
Use them together. A low cost with a long payback can strain cash, and a high cost with strong lifetime value can still be sensible. Our guide to CAC payback shows how to calculate it and where the common errors sit. For the marketing side, see what ROI in marketing means.
Segment these by channel and customer type. Blended averages hide the segments that earn their keep.
Keep the board view small
Choose roughly a dozen metrics for the whole company, grouped under pipeline, conversion, cost and retention. Everything else lives one click deeper for the people who need it.
Good measures also support enhancing sales strategies, because they show which segments and channels deserve more effort. Our GTM metrics guide offers a way to choose them.
Forecasting accuracy comes from clean inputs and a consistent method
Sales forecasting is where revenue intelligence is judged, and more accurate forecasts are the clearest sign that the system works. Forecasts also tell you about future sales and revenue targets early enough to adjust.
A forecast is a promise to the board, and leaders remember when it misses. Better forecasts come from three habits rather than from one clever model.
The first habit is a stable method. Decide whether you forecast from weighted pipeline, from stage conversion history, from rep judgment or from a blend. Write it down and use it every period, so changes in the number come from the business and not from the method.
The second is clean inputs. Close dates, amounts and stages must be current, and risk factors such as a missing champion or a stalled stage should be recorded where the forecast can see them. A forecast built on stale fields is a more precise way to be wrong.
The third is measuring the error. Compare each forecast with what happened, by period and by owner, and keep the record. Forecasting accuracy only improves when someone reviews the misses.
Gartner's survey gives a reason to involve leadership. It found that sales analytics led by the chief sales officer were 2.3 times more likely to achieve higher forecast accuracy than analytics not led by that role.
Use predictive analytics as a second opinion
Predictive analytics and machine learning models score deals and estimate the chance of closing from historical data. Predictive forecasting replaces subjective estimates with a view based on buyer engagement and historical trends.
They are useful as a check on human judgment. If a model and a rep disagree about a large deal, that is a good reason to look at the deal.
They are less useful as a replacement for method. A model trained on messy history reproduces the mess. Fix the foundations first, then add prediction. Data analytics and artificial intelligence only help once the inputs are sound.
Our guide to revenue forecasting walks through the methods and how to choose among them.
Attribution shows which marketing work produces revenue
Marketing teams need to know which programs create pipeline and which only create activity, so they can allocate resources to the programs that support revenue generation. Attribution answers that by assigning credit for a deal to the interactions that led to it. Our guide to revenue attribution covers the setup in detail.
Models differ in how they share the credit. HubSpot's knowledge base describes the common ones. In its attribution reporting documentation, first touch "gives all credit to the first interaction," last touch gives all credit to the last interaction before conversion, linear gives equal credit across all interactions, and time decay gives more credit to interactions closer to the conversion.
No model is correct. Each is a different lens. First touch favors the channels that introduce buyers. Last touch favors the ones that close them. Multi-touch models spread credit across a long B2B journey, which suits long cycles with many contacts.
Why attribution never tells the whole story
Much of the influence on a B2B purchase happens before a buyer talks to anyone. The 6sense 2025 B2B Buyer Experience Report, a global study of nearly 4,000 buyers, found that 95% of the time the winning vendor is already on the buyer's Day One shortlist, and that the point of first contact moved to 61% of the journey.
That means a lot of influence leaves no trace in your CRM. Podcasts, communities, peer conversations and search all shape the shortlist. Use attribution to compare programs you can track, and pair it with a simple question on forms: how did you first hear about us? The answers fill part of the gap.
Pick a model by the question you are asking
Use first touch to judge which programs bring new buyers. Use last touch to judge which offers close them. Use a multi-touch model to judge the whole journey. Then compare the views. When they agree, you can act with confidence. When they differ, the difference is the finding.
Dashboards give each role pipeline visibility and a next action
A dashboard earns its place when it changes a decision. Build each one around a question a specific person asks on a regular schedule, not around the data you happen to have. A data driven approach means you analyze data, then make data driven decisions with named owners.
Revenue leaders need one view that shows target against forecast, pipeline coverage and movement from last period. Sales managers need deal-level and rep-level views to track sales performance and coach sales reps. Marketing teams need program performance traced to pipeline. Customer success needs renewal and expansion risk.
Keep each dashboard to a handful of tiles with a written definition under every one. Data overload is the opposite failure: too many tiles make it hard to pull actionable insights from any of them.
Our guide to the marketing KPI dashboard shows how to lay one out by funnel stage, and the guide to HubSpot dashboards shows how to build them where your CRM data already lives.
Real time insights matter only when someone is watching
Real time insights sound attractive, but speed only helps when a person is ready to respond. A deal that goes quiet is worth an alert to its owner the same day. A weekly board number gains nothing from refreshing every minute.
Match the refresh rate to the decision. Daily is enough for most pipeline work. Reserve instant alerts for events that need an immediate human response, such as a stalled late-stage deal or an unexpected cancellation notice.
Design the dashboard for the meeting
Work backward from the meeting where the dashboard will be used. List the three decisions that meeting makes, then show the numbers that inform them. Remove everything else. A dashboard that nobody opens in a meeting becomes decoration within a quarter.
Conversation intelligence and AI add signal from calls, but they sit on top of the basics
Conversation intelligence records and analyzes sales calls and meetings. It can show which topics appear in won and lost deals, how much of a call a rep spends talking, and which competitor names come up. Those are sales interactions that structured CRM fields rarely capture.
Used well, it supports sales coaching and sales efficiency. A manager can review specific moments rather than rely on a rep's recollection, and can compare how top reps handle an objection with how others do.
It also tracks buyer sentiment and the objections customers raise most often, which shows the strengths and weaknesses in your sales process.
It also feeds the CRM with next steps and risks without manual entry, which gives sales teams more time with buyers. Revenue enablement teams use the same recordings to build training.
AI powered features go further. Gartner's market guide abstract says vendors "seek to differentiate themselves through a combination of predictive and generative AI (GenAI), real-time interventions, and out-of-the-box options for data visualization and dashboards." Treat that as a sign of where the market is heading and judge each feature by whether it changes a decision.
A test for any AI feature
Ask four questions. What data does it use? Can you see why it made its recommendation? Who acts on the output, and when? What happens if the output is wrong? A feature that cannot answer them will produce results nobody trusts, which wastes the effort.
Salesforce's 2024 survey points to a related risk. When only 35% of sales professionals completely trust their organization's data, AI built on that data inherits the doubt. Fix the data and the AI is easier to believe.
Respect customer privacy
Call recording and analysis involve personal data. Tell buyers when calls are recorded, follow the laws of the markets where you sell and keep access limited to the people who need it. In Gartner's survey, data privacy concerns or regulations were the most cited barrier to analytics success, at 45% of respondents. Plan for it from the start.
A revenue intelligence platform is one option, not the starting point
A revenue intelligence platform is software that captures activity, unifies sales data and surfaces pipeline analysis, forecasts and recommended actions in one place. Other terms for it include revenue intelligence software and revenue intelligence tools. They differ in depth, but they share a goal: a single source of truth for revenue.
Lists of the top revenue intelligence platforms rank vendors on features, but fit with your process matters more.
Whether you need one depends on where you are. A small team with a clean CRM and a handful of reports may need only better dashboards. A team with several selling motions, many reps and a forecast that matters to investors may benefit from a platform that captures activity and scores deals.
What a platform adds beyond CRM reporting
A CRM reports on the fields people fill in. A platform adds activity captured automatically, call analysis, deal scoring and forecasting views across roles. Those additions matter most when manual entry is the weak point.
They add little when the weak point is definitions. If two leaders define a qualified opportunity differently, software will faithfully report both versions.
What to check before you buy
Choosing the right revenue intelligence platform comes down to fit with your process. Check how it connects to your CRM, how it handles data you already hold, what each role will actually use, whether you can see how it reached a score and what it takes to maintain.
Also ask who will own it. A tool without an owner decays. Buying before the foundations are ready is how a tool ends up blamed for problems that began in the data. For HubSpot users, start by seeing what the reporting you already have can do before adding anything.
If you are weighing the decision now, the answer depends on stage and data readiness, and a short audit of your systems is the cheapest way to find out.
Governance keeps revenue intelligence honest
Governance sounds heavy, but at this scale it means a few written rules and a named person. Without it, definitions drift, dashboards multiply and trust erodes.
Write a metric dictionary. For each number in your reports, record the name, formula, source field, owner and review date. Keep it where everyone can find it. When two people disagree, the dictionary settles the question, and any change is logged.
Decide who can change what. Stage definitions, required fields and scoring rules should have an owner and a change process. A rep should not be able to move the definition of a win by editing a picklist.
Set data access rules, and treat shared reports as valuable insights that deserve the same care as the data behind them. Customer data, call recordings and compensation-linked numbers need clear permissions. Review them when roles change.
Audit on a schedule. Check duplicates, missing fields and stale deals each month, and report the result next to the metrics themselves so people see the quality of the data behind the number.
Align the teams that share the numbers
Revenue intelligence crosses sales, marketing and customer success, and the hard problems are usually between teams. HubSpot's 2026 State of Marketing report, based on more than 1,500 marketers, found that 27.6% named sales-marketing alignment among their top challenges.
Lack of transparency on customer interactions makes this worse, because teams cannot collaborate on what they cannot see. A shared view of every interaction improves collaboration between sales and marketing teams. A shared set of definitions is the practical fix: one funnel, one lead definition, one revenue target.
Run revenue intelligence on a weekly, monthly and quarterly rhythm
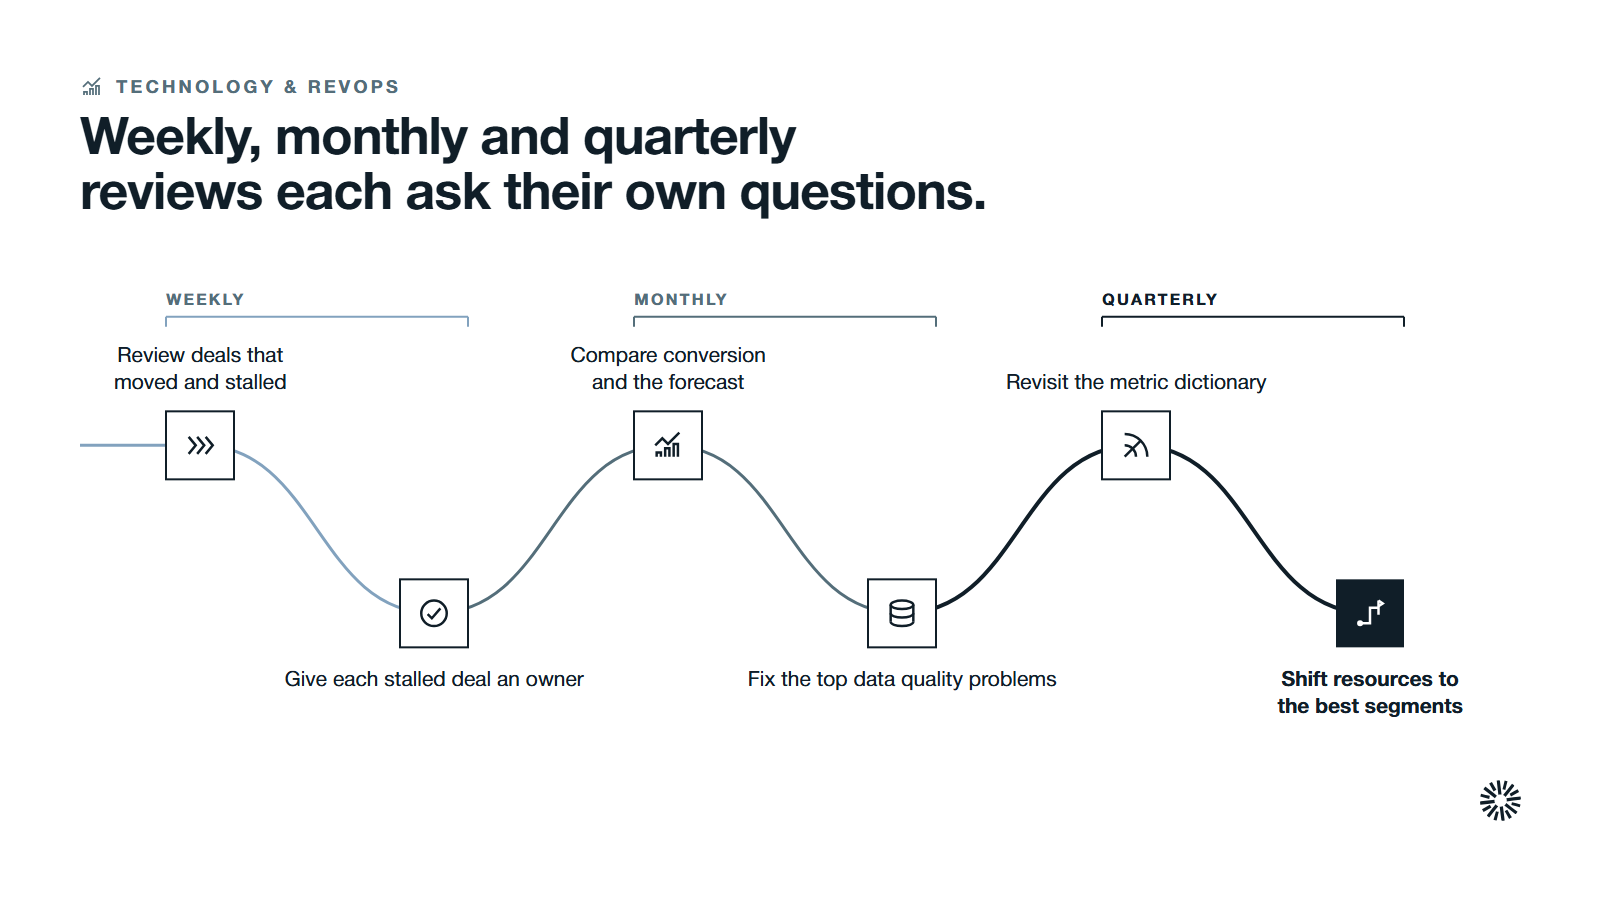
Tools do not change results by themselves. A review rhythm does. Set three cadences, each with its own questions and owner.
Weekly: pipeline and next actions
Run a short pipeline review with sales managers and reps. Look at deals that moved, deals that stalled and deals with no next step. Each stalled deal gets an owner and an action. Check that required fields are filled for the deals under discussion. The aim is movement, not reporting. Our guide to pipeline review offers a structure for it.
Monthly: conversion, forecast and data quality
Review stage-to-stage conversion, win rate by segment and the forecast against actuals. Record the forecast error and its cause. Review the data quality checks and fix the top problems. Marketing teams bring program results traced to pipeline, and customer success brings renewal risk.
Quarterly: strategy, targets and resource allocation
Use the quarter to ask bigger questions. Which segments earn the best return? Where should you shift resource allocation? Which metrics should change, and which definitions need updating? Revisit the metric dictionary and retire reports nobody used. This is also the time to decide whether a platform or new process is justified by what you have learned.
Common mistakes that make revenue intelligence fail
Most failures follow a few patterns, and each can be avoided.
- Buying software before settling definitions. The tool reports whatever you configure, including disagreement.
- Tracking too many metrics. A long list invites selective reading. A short list invites action.
- Averaging across segments. Blended win rate, cost and cycle length hide the segments that deserve more or less investment.
- Trusting one attribution model. Compare views, and remember that much influence is invisible.
- Ignoring customer data. Winning revenue you cannot retain is a weak result.
- Treating dashboards as the finish line. An insight needs an owner and a date.
- Skipping the review of misses. Forecasts and models improve only when someone studies what went wrong.
- Letting data quality slide. One quarter of neglect can undo months of work.
What you gain when this is done properly
When the foundations, the metrics and the rhythm are in place, revenue intelligence stops being a project and becomes the way your team runs the business. The gain is shared, though each team feels it differently.
Sales gets clearer priorities and better coaching
Sales reps see which deals need attention and why. Sales managers coach from evidence in the pipeline and in the calls, not from memory. Time spent on manual updates goes back to selling, which matters because Salesforce's 2026 survey found the average seller spends 40% of their time selling.
Marketing sees which programs create revenue
Marketing teams can trace programs to pipeline and to closed revenue, and shift budget toward the work that earns it. Shared definitions with sales reduce the arguments about lead quality, because both teams look at the same numbers.
Customer success sees risk and expansion earlier
With unified data, customer success sees the original deal context, product usage and renewal dates in one view. Accounts that show warning signs are visible sooner, and expansion opportunities reach the right person with the right history.
Start with your questions, then build the system that supports revenue growth
Revenue intelligence works when it answers real questions: where does the quarter stand, which deals will move, which programs earn their cost and which customers need attention. Begin with those questions, settle the definitions, clean the data and set the rhythm. Add tools last.
The aim is to accelerate revenue growth by pointing effort at the best opportunities and to maximize revenue from the customers you already have.
Propello designs and builds connected go-to-market systems on HubSpot for CEOs and revenue leaders at growing B2B companies. If you want a second pair of eyes on your data, metrics and reporting before you invest further, an audit is the place to start.