If you lead a sales team at a growing B2B company, you probably have more sales data than anyone has time to read. Sales analytics is the practice of turning that data into answers about what is happening in your pipeline, why, and what to do next.
This article is for CEOs, founders, sales leaders and revenue operations managers. It explains what sales analytics covers, the four types and the question each one answers, the sales metrics worth tracking, the benefits of sales analytics for each team, and the data you need in place before any of it is trustworthy. For the full picture, read our complete guide to revenue intelligence.
|
Sales Analytics Sales analytics is the practice of collecting and analyzing sales data to explain past performance, find what drives it, and predict and guide future sales results. |
How sales analytics works from raw data to decisions
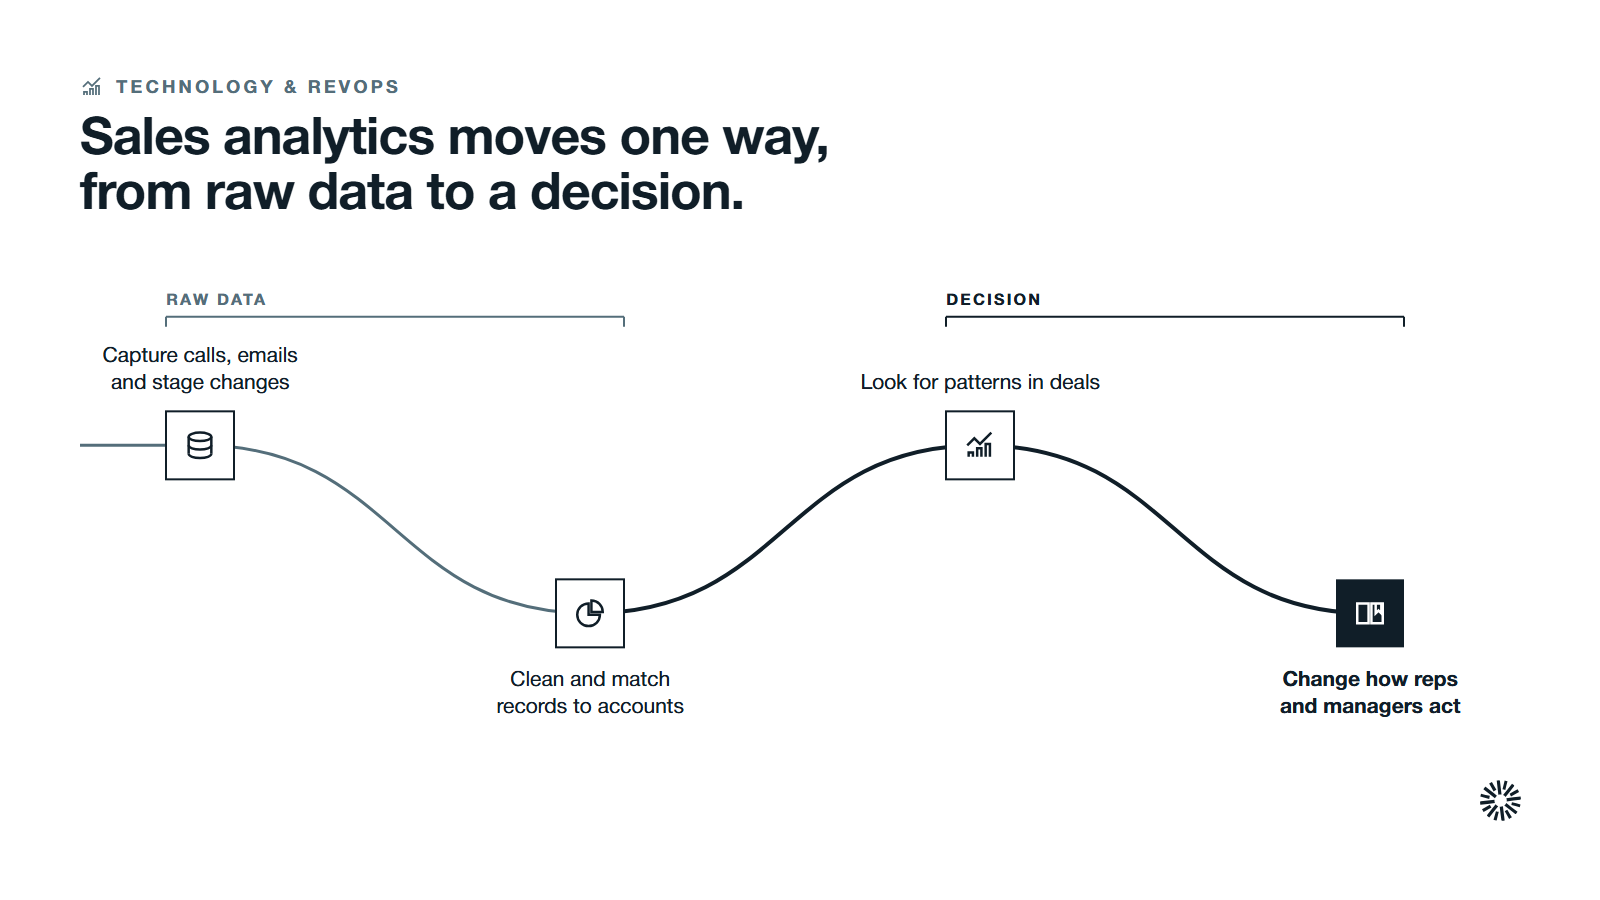
Sales analytics moves in one direction. Raw data goes in at one end, and a decision comes out at the other. Each step depends on the one before it, so a weakness early on shows up as a wrong answer later.
The first step is capture. Every call, email, meeting, quote and stage change a rep records in your customer relationship management (CRM) system becomes one of your sales data points. Those customer interactions are the raw material. If an interaction is not recorded, it cannot be analyzed.
The second step is preparation. Records are cleaned, matched to the right account and put into one consistent format, so that "closed won" means the same thing for every sales team and region. Good data analysis starts with this step, because interpreting sales data from mismatched records produces mismatched answers.
The third step is analysis. Sales analysts, sales operations or the tools themselves look for patterns: which deals move, which stall, which lead sources turn into revenue. Methods range from simple comparisons to data mining techniques that search large sets of records for relationships a person would miss.
The last step is action. A finding only counts when it changes something, such as how a rep spends the week or how a manager coaches. Analysis that never reaches a decision is reporting with extra steps.
Why sales analytics is important for your sales strategy
A sales strategy is a set of bets: which customers to pursue, which offers to lead with, where to place your people. Sales analytics is how you find out which bets are paying off. Without it, a strategy is argued from memory and the loudest voice in the room.
The benefits of sales analytics fall into three groups. It improves decisions, because choices rest on evidence rather than habit. It improves sales performance, because managers can see which behaviors separate the strongest deals from the weakest. And it supports revenue growth, because it shows where effort is wasted and where it earns its keep.
Analytics also helps you read the wider picture. Historical data shows sales trends across quarters, segments and products, and it shows how those patterns move with market trends such as budget cycles or a competitor's launch. That context keeps a good quarter from being mistaken for a lasting shift in sales growth.
The goal is actionable insights: findings specific enough that a manager knows what to do on Monday. A chart that says sales are down is a report. A finding that says deals stall after the proposal stage in one segment is a decision waiting to be made.
The four types of sales analytics answer four different questions
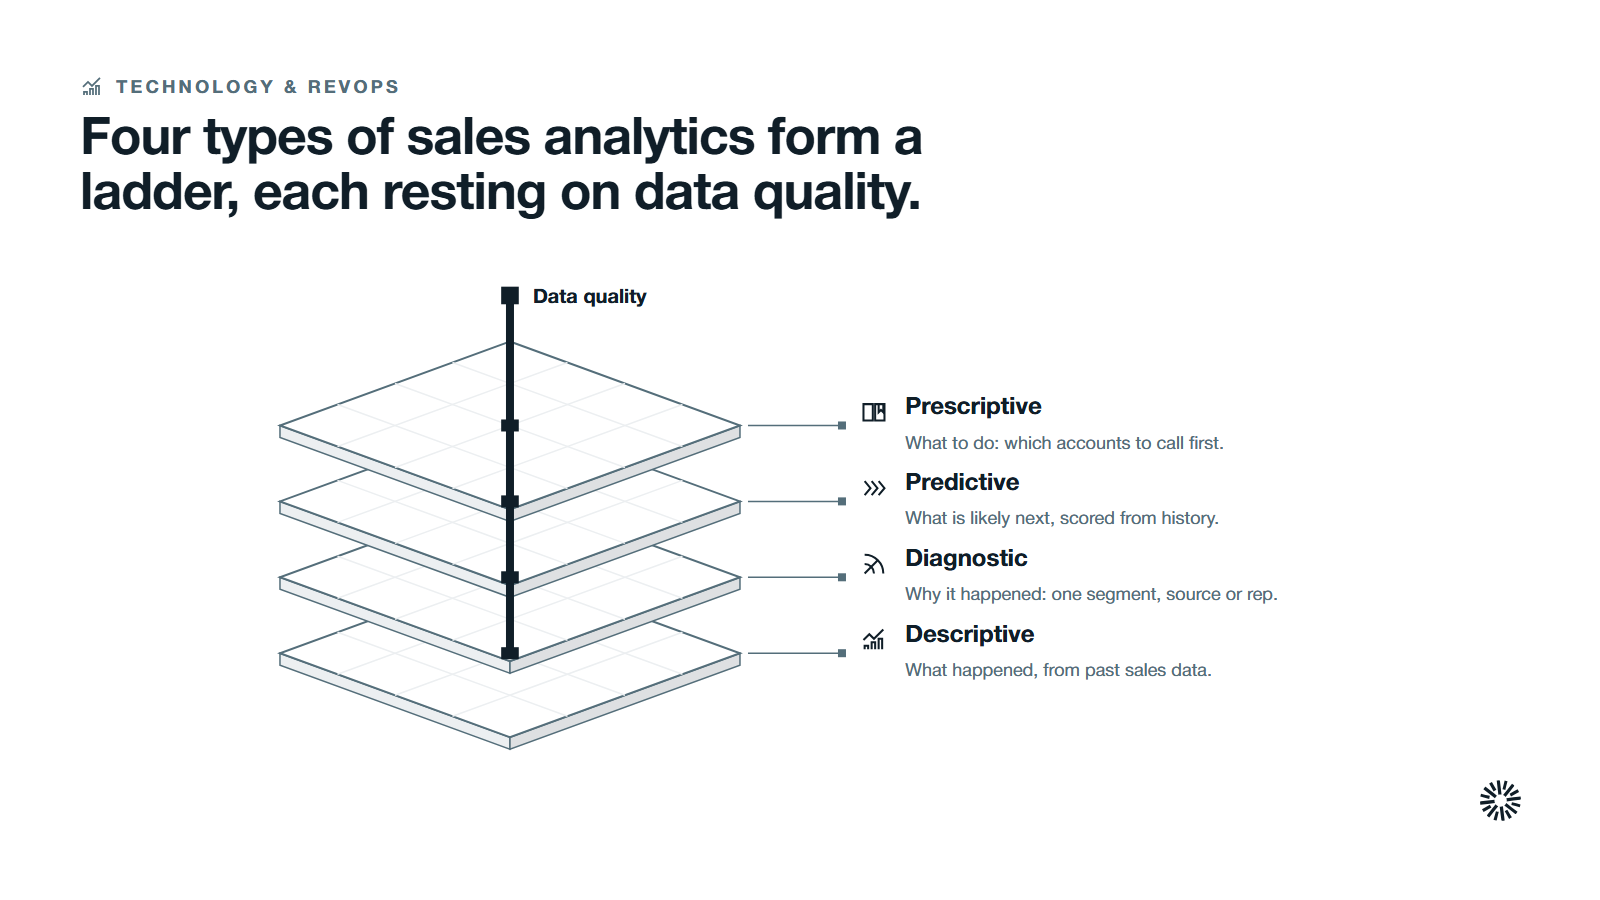
The types of sales analytics form a ladder. Each rung answers a harder question than the one below it, and each depends on the data quality of the rung beneath.
Descriptive analytics tells you what happened
Descriptive analytics summarizes past sales performance using historical data. It answers questions like how many deals closed last quarter, what the average deal size was and how much pipeline you carry today. Most sales reports live here, and it is where every team should start.
Charts and real-time dashboards make this layer easy to read, because a trend that is hard to see in a table often stands out in a line.
Diagnostic analytics tells you why it happened
Diagnostic analytics digs into the cause. If win rates fell, it asks whether the drop sits in one segment, one lead source or one rep. It compares groups and looks for the factor that separates won deals from lost ones.
Predictive analytics tells you what is likely to happen
Predictive analytics uses historical sales data to predict future sales and predict future outcomes. It scores which deals are likely to close and projects future revenue from the patterns in past behavior. This is the same family of data analytics that powers a forecast. It is only as good as the history behind it.
Prescriptive analytics tells you what to do about it
Prescriptive analytics recommends an action: which accounts to call first, which deals need an executive sponsor, where to move resource allocation. It sits at the top of the ladder because it needs the other three to work.
Most teams do not need all four on day one, and none of the four replaces judgment. Get descriptive reporting right, then add diagnostic questions, and move up only when the data can support it.
Sales metrics that sales analytics tracks
A metric is useful when someone can act on it. The sales metrics below cover the full path from first lead to closed deal. These are the key performance indicators for a typical B2B team. Pick the few that match the decisions your team actually makes.
| Metric | What it tells you |
|---|---|
| Pipeline coverage | Whether you have enough open pipeline to reach your sales target |
| Win rate | The share of opportunities that become closed deals |
| Average deal size | How much revenue a typical won deal brings |
| Average sales cycle length | The time from first contact to closing a deal |
| Pipeline velocity | How quickly leads move through the sales pipeline |
| Lead conversion rate | How many leads become qualified opportunities |
| Forecast accuracy | How close the forecast was to actual sales |
| Sales per rep | The total revenue each rep generates, and how output compares across the team |
| Sales growth | The increase in revenue over time |
Two entries in the wider literature deserve a note. Average purchase value is the consumer-side cousin of average deal size, and sell-through rate is a retail inventory measure. Neither is a core B2B sales metric, so you can skip both unless you sell physical goods.
Each metric has a clean definition, and agreeing on it matters more than the metric you pick. Your definition of an "opportunity" decides every conversion number that follows. Sales pipeline stages explains how to define stages so these numbers mean something.
What each question needs: from pipeline management to coaching
Sales analytics earns its place by answering specific questions for specific people. Here is how the work divides.
Pipeline management and the sales funnel
Pipeline management asks whether the funnel is healthy and whether your sales process is working as designed. Analytics finds bottlenecks, flags at-risk deals before they stall, shows where deals leave, how long they sit in each stage and whether the sales pipeline is large enough for the target.
A stage with a sudden pile-up is a prompt to investigate, not a number to report.
Forecasting future revenue
Forecasting asks how much you will close and when. Sales forecasting tools, from a spreadsheet to a dedicated platform, all depend on the same inputs that sales analytics supplies: stage conversion, historical rates and sales cycle length.
Accuracy depends on data quality and a clean link to your CRM, and a sound forecast also feeds budgeting, planning and resource allocation. Revenue forecasting shows how to turn those inputs into a forecast you can defend.
Rep performance and coaching
Sales managers use analytics to judge sales team performance and to see where each of their sales reps is strong and where deals slip.
The point is coaching, not ranking, and the same view helps a manager improve sales performance across the team. A rep with a low win rate at one stage needs a different conversation than a rep who rarely creates pipeline.
Territory, targets and resource allocation
Sales leaders use analytics to set a realistic sales target, decide where to hire and balance territories, which is sales management at its most practical. Past performance by segment shows where effort pays back and where it does not.
Customer behavior and retention
Sales data also holds clues about customer behavior. Patterns in what existing customers buy, and when, feed customer retention and expansion plans, and show which lead generation sources bring buyers who stay. Studying purchase behavior also supports segmentation, so high-value segments get targeted marketing, and it shows which products customers tend to buy together, which helps with bundling.
The data you need before sales analytics is trustworthy
Analytics cannot fix bad data. It amplifies it. Before you invest in dashboards, check the foundation.
The numbers show why this matters. Salesforce's 2024 State of Sales research found that only 35% of sales professionals completely trust the accuracy of their organization's data. If your own team half-trusts the numbers, they will half-trust every report built on them.
Sales teams are responding. Salesforce's 2026 State of Sales report, based on a survey of 4,050 sales professionals, found that 74% are focusing on data cleansing, and that 79% of high performers prioritize data hygiene compared with 54% of underperformers.
Four things need to be in place:
- One source of truth. Customer data, deal data and activity data live in a connected system, not in separate spreadsheets.
- Consistent definitions. Stages, close dates and deal values mean the same thing for every sales team.
- Complete records. Required fields are filled in at the time of the work, not reconstructed at quarter end.
- Clear ownership. Someone in sales operations owns data quality and fixes it when it slips.
Notice that none of these is a software purchase. They are operating habits, and they come first.
Sales analytics tools, software and platforms
Sales analytics tools collect, clean and display the data. Your CRM probably already includes reporting, and many teams add dedicated sales analytics software or sales analytics platforms when they need deeper analysis, forecasting or predictive scoring. Connecting the tool to the CRM keeps the data accurate and the insights current, and automating routine analysis leaves reps more time to sell.
When you compare options, judge them on a short list of requirements rather than a feature count:
- Does it connect to your CRM and the other systems that hold customer data?
- Can sales leaders build and change reports without waiting for an analyst?
- Does it let you trace any number back to the records behind it?
- Can your sales team use it in the flow of work, or will they avoid it?
The best sales analytics software for your business is the one your reps and managers will open every week. A tool does not replace definitions, clean data or a decision rhythm. It makes them visible.
Training matters too, because a team has to be shown how to read the dashboards before they become part of the weekly routine. Treat analytics tools as the last piece of the system, not the first.
How sales analytics differs from sales reporting
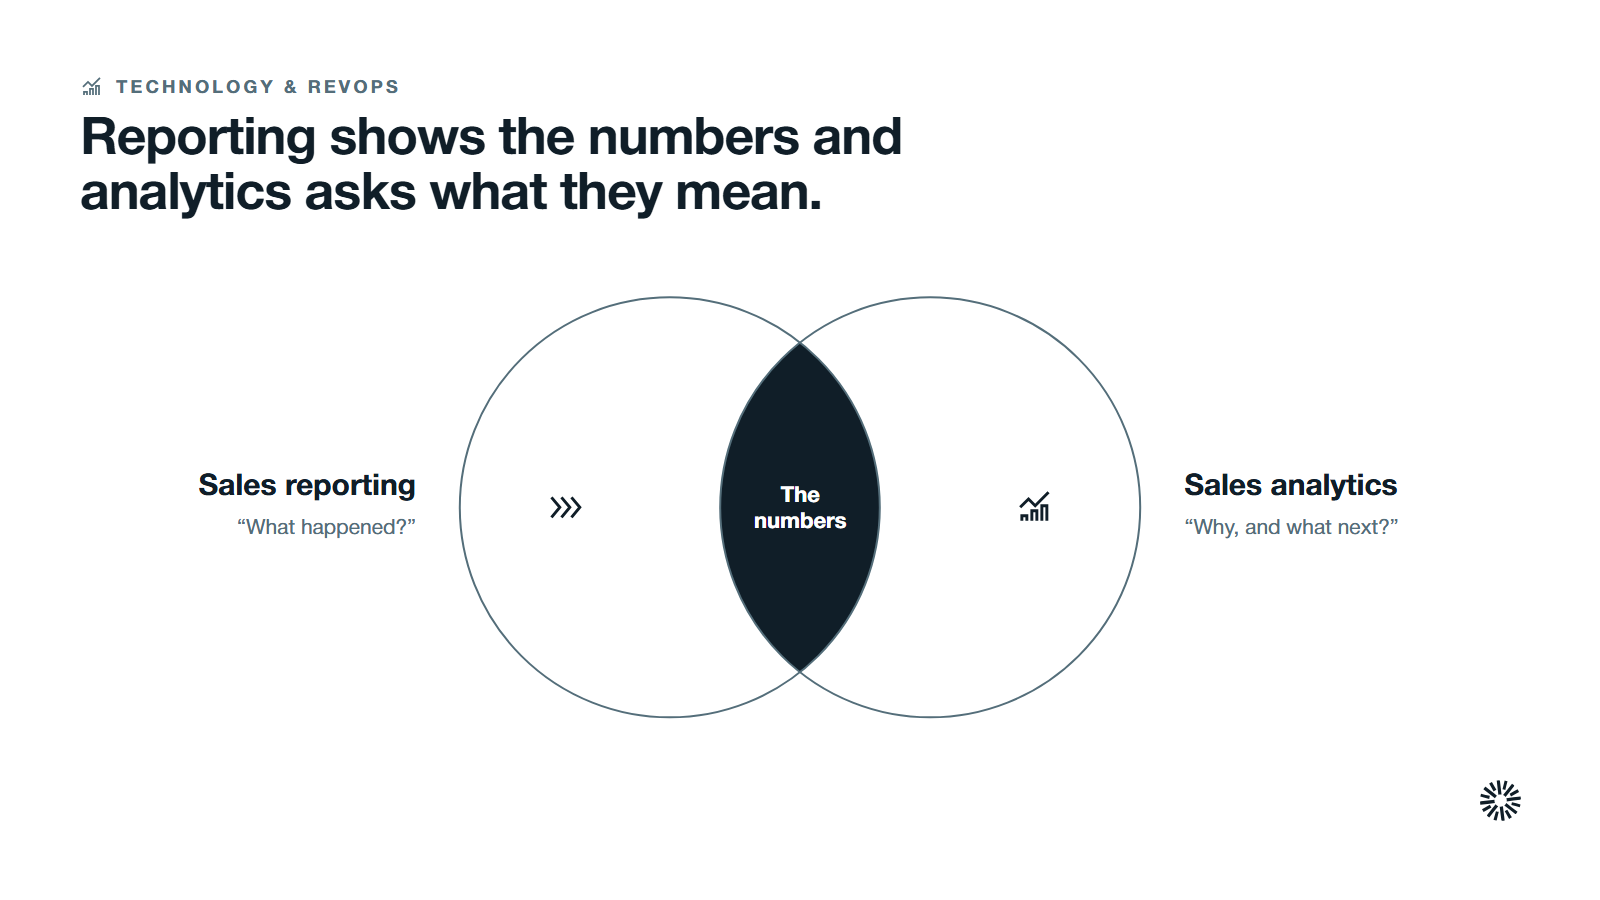
Sales reporting and sales analytics are neighbors, and teams often confuse them. A report shows what the numbers are. Analytics asks what they mean and what to do.
| Sales reporting | Sales analytics | |
|---|---|---|
| Main question | What happened? | Why did it happen, and what next? |
| Output | Dashboards, tables, totals | Findings, predictions, recommendations |
| Typical user | Anyone who needs the number | Sales leaders, analysts, operations |
| Risk | Numbers without meaning | Conclusions without clean data |
Reporting is the base of analytics, not a rival. You cannot explain a number you cannot see. But a team that only reports can tell you it missed the target and nothing about why.
Analytics is also not the same as sales forecasting. Forecasting is one use of analytics, the one that estimates a number for a future period. Analytics also covers coaching, territory design, lead quality and more. Revenue operations often owns the system around it, bridging the gap between strategy and sales execution.
What you gain when this is done properly
When sales analytics runs on clean data and shared definitions, each function gains something concrete.
Sales gains focus and fewer surprises
Sales teams spend more of their week on the deals most likely to close, because analytics shows which ones those are. Managers see problems in the pipeline while there is still time to act, and the quarter holds fewer late shocks.
Salesforce's 2026 State of Sales report found the average seller spends 40% of their time selling, so every hour returned to selling counts.
Marketing gains a view of which leads become revenue
Marketing sees which lead sources produce deals that close and which only produce volume. That turns campaign planning from a guess into a choice, and gives sales and marketing one set of numbers to argue about instead of two.
Customer success gains earlier warning and clearer expansion signals
Customer success teams use the same sales data to see what customers bought, how long onboarding took and where accounts are ready to grow. Handoffs from sales carry real context, so the first conversation after the sale starts informed.
Start with the questions, then build the system
Sales analytics works when it starts with the questions your leaders need answered and works back to the data. It fails when it starts with a tool and hopes the questions follow.
Propello designs and builds connected go-to-market systems on HubSpot. If you cannot yet say which of your sales metrics you trust, or where your sales data breaks between systems, an audit is the place to start.