
If you lead marketing or revenue at a growing B2B company, website analytics is how you learn which pages, channels and campaigns bring buyers, and which only bring visits. You get there by collecting clean data, marking the actions that matter, and reading a short set of metrics on a fixed routine.
This article is for CEOs, founders, CROs and marketing leaders who have an analytics account but no trusted answer to "what is the website doing for pipeline?" You will get a definition, a picture of what good looks like, the metrics with their formulas, an analytics dashboard layout, and a weekly, monthly and quarterly routine.
|
Website Analytics Website analytics is the collection and reading of data about how people reach, use and act on your website, so you can judge which pages and channels support business goals. |
Good website analytics answers a revenue question, not a traffic question
Counting website traffic is the easy part. A page full of charts is not analysis. Good website analytics lets you say, in one sentence, which channel brought the site visitors who became leads, which web pages helped, and where visitors gave up. The aim is actionable insights, not more charts.
This guide is about your own site. Tools that estimate the traffic of other people's websites work from outside panels and models, so they show a rough picture of a competitor, not your own data.
The sections below cover the data you collect yourself. You do not need deep technical expertise to read it, but someone must own the tracking code.
A team with working website analytics has five things in place:
- One tracking code on every page, checked on a schedule.
- A short list of key events that mark the actions you want, such as form submissions and demo requests.
- Campaign links tagged with one naming pattern, so traffic sources are readable.
- Internal visits filtered out, so your own team does not inflate the numbers.
- One analytics dashboard that sales and marketing both open every week.
If any of the five is missing, fix it before you compare channels. A weak foundation produces confident conclusions about the wrong thing.
Web analytics works in four stages: collection, measurement, analysis and reporting
Every web analytics setup follows the same path. It collects data from each visit, measures it as sessions, users and events, analyzes patterns across pages and channels, and reports the result to the people who decide.
Data points reach the system in a few ways: page tagging, which runs a small script in the browser, server log files, cookies, and outside services. Most teams use page tagging, because it records user interactions such as clicks and scrolls that a server log cannot see.
Know the basic units before you read a report. A session is a group of interactions on your site within a period of time. A pageview is counted each time a page loads in a browser, and unique pageviews combine repeat views of the same page by one user in one session.
The analytics data you gather is only as good as the traffic data behind it.
On-site web analytics measures what visitors do on your pages. Off-site web analytics looks at reach and conversation beyond your site, such as social media and other websites. This guide focuses on the first.
Collect clean website data before you read any report
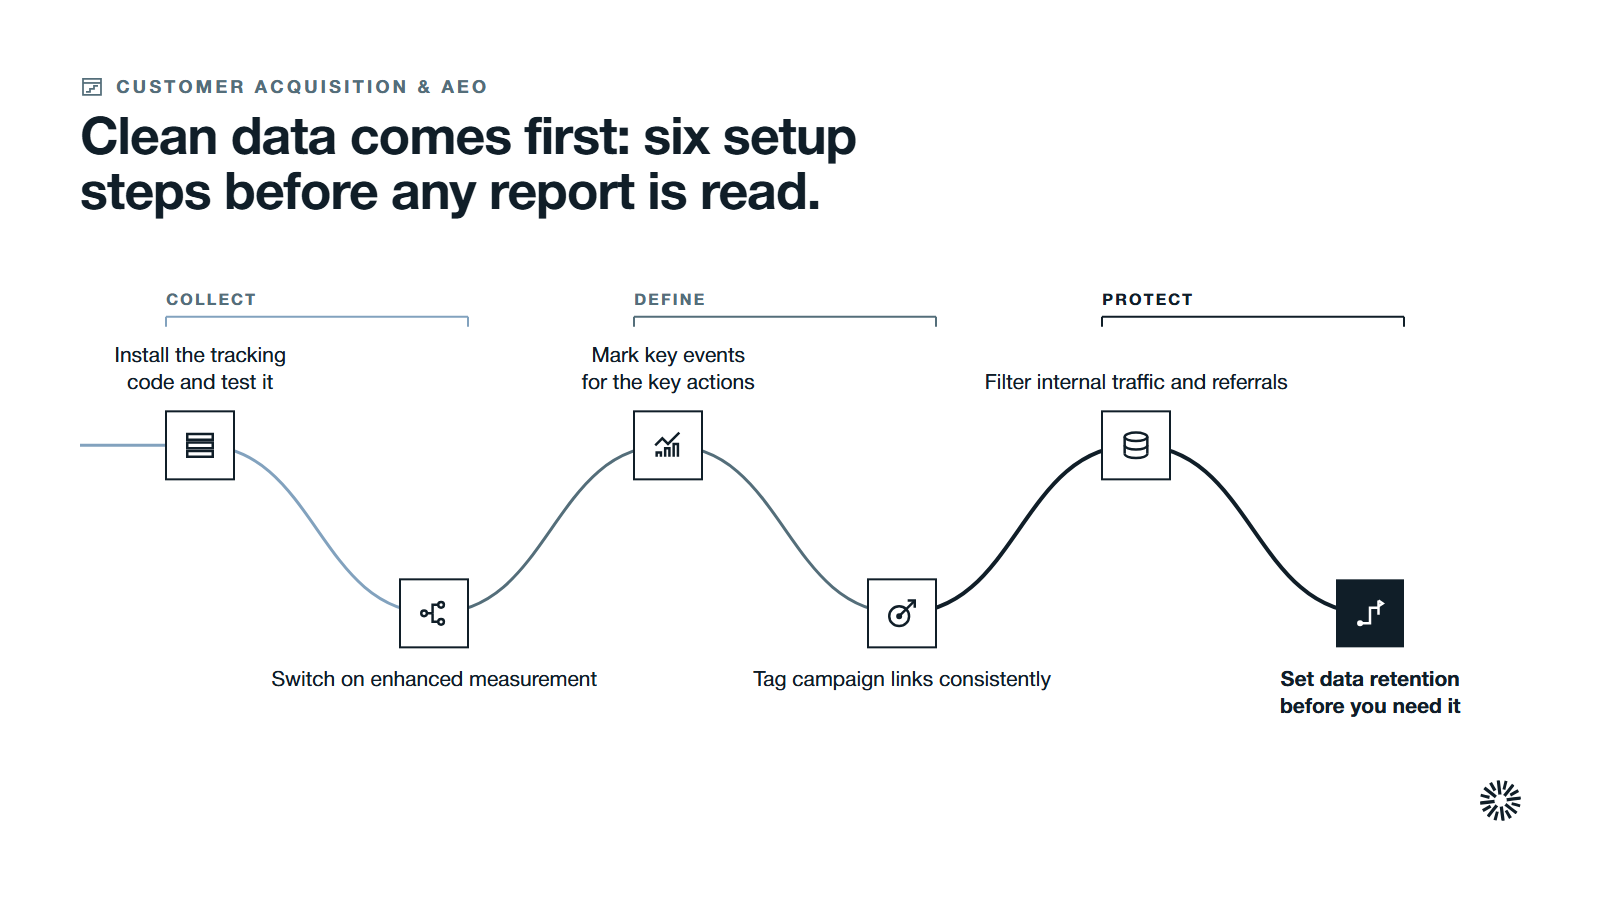
Everything downstream depends on data collection, and the right data starts with the tag. Google's own overview of how Google Analytics works says you add a small piece of JavaScript code, the measurement code, to each page.
The code collects pseudonymous information about how each visitor interacted with the page, plus the browser language, browser type, device and operating system. In short, visitor data collection includes device types, not only page views.
It also collects the traffic source, which is what brought the visitor to the site in the first place: search engines, an ad or an email campaign. Organic search (unpaid search results), paid search, email and direct visits each need their own row in your reports.
Install the tracking code once and test it
Add the measurement code to every page template, then open your site in a fresh browser and confirm the visit appears in the Google Analytics real-time report. Check landing pages from ads and email separately, because they often sit on different templates.
Done looks like this: every public page, including thank-you pages and pages on a separate form domain, sends data to the same property.
Let enhanced measurement cover the basics
Google's page on enhanced measurement events explains that you can enable events such as page views, scrolls, outbound clicks and site search in the interface, with no code changes. These user interactions would otherwise need custom code. Switch them on, then review each one so you understand what is collected.
The same page states that you are required to ensure no personally identifiable information is collected. Keep names and email addresses out of page URLs and event parameters.
Mark key events for the actions that matter
Google's page on key events defines a key event as an event that measures an action that is particularly important to the success of your business, and says any event you collect can become one. Its events page adds that custom events should be created only when no other event works for your use case.
In Google Analytics, mark the events that match your goals. For a B2B site, start with demo requests, contact form submissions, pricing page visits that reach a form, and meeting bookings. Keep the list short.
Done looks like this: every key event fires once per real action and shows in the Key events column of your landing page and acquisition reports.
Tag campaigns so traffic sources stay readable
Every link you control needs campaign tags. Google's URL builder page says to always use source, medium and campaign parameters, and to keep a strict, case-sensitive naming convention, because Meta and meta are treated as different values.
Our guide to what a UTM code is shows how to build and govern those tags. Use lowercase, one pattern for every team, and one owner for the list.
Filter internal traffic and unwanted referrals
Your own staff, agencies and developers create visits that look like interest. Google's page on filtering out internal traffic explains that you can exclude activity by IP address, up to 10 data filters per property, and warns that once a data filter is applied, its effect on the data is permanent.
Test a filter before you make it active. Also review unwanted referrals when you use a separate domain for payments, booking or forms, so that traffic from your own domains is not counted as a referral from another site.
Set data retention before you need the history
Google's data retention page says that for standard properties you can keep user-level data and event-level data for 2 months or 14 months. Exploration reports cannot reach beyond that period, although standard aggregated reports are not affected.
Choose 14 months if year-over-year comparison matters to you, and export the numbers you need to keep for longer.
The website analytics metrics worth tracking, with formulas
Too many metrics hide the signal. Pick a small set of critical metrics that map to business objectives, and compute them the same way each month, so other metrics have a stable baseline to move against.
Our wider guide to website metrics to measure and track covers the full menu. These are the key metrics that tie the site to business outcomes.
The arithmetic below uses one invented month and is illustrative, not a benchmark: 4,000 sessions, 3,000 engaged sessions, 1,200 new users out of 3,000 total users, 80 form submissions and 20 qualified leads.
Engagement rate and bounce rate
Google's page on engagement rate and bounce rate defines an engaged session as one that lasts longer than 10 seconds, has a key event, or has 2 or more page or screen views. Engagement rate is the percentage of engaged sessions. Bounce rate is the opposite: the percentage of sessions that were not engaged.
Formula: engagement rate = engaged sessions / sessions x 100, and bounce rate = 100 minus engagement rate.
Illustrative arithmetic: 3,000 / 4,000 x 100 = 75%, so the bounce rate is 25%.
Read bounce rate by page type, because user behavior differs by page. A one page visit to a contact page with a quick answer can still do its job, while a pricing page with the same rate deserves a look.
Older tools report average session duration. Google's user engagement page describes engagement time instead: the time your web page is in focus. It is a better guide than time on site, and you can compare it across multiple sessions to see whether visitors return.
Conversion rate
Conversion rate shows how many visits ended in an action you care about.
Formula: conversion rate = sessions with a key event / sessions x 100.
Illustrative arithmetic: 80 / 4,000 x 100 = 2%. Calculate it for the whole site, then by channel and by landing page, because the site-wide figure hides both your best and worst pages.
New and total users
Google's dimensions and metrics page defines total users as the number of unique user IDs that triggered any event, and new users as the number of new unique user IDs that logged a first visit.
Formula: new user share = new users / total users x 100.
Illustrative arithmetic: 1,200 / 3,000 x 100 = 40%.
A falling share can mean your reach is stalling. A rising share with a falling conversion rate can mean each new visitor is arriving from the wrong audience.
Older reports talk about unique visitors, and Google Analytics counts users instead, using the definitions above. A new visitor is a first visit, and a returning visitor has been seen before. Overall traffic can grow while qualified leads fall, so never read one without the other.
Channel contribution
Traffic sources only help when they are grouped sensibly. Google's default channel group page explains that channels are rule-based definitions of your traffic sources, so you can monitor how each one performs.
Formula: channel contribution = key events from a channel / all key events x 100.
Illustrative arithmetic: 30 / 80 x 100 = 37.5%.
Compare it with the channel's share of marketing spend, so you see which marketing channels earn more than they cost. Look at how different channels work together across the customer journey, not only at the last click, and compare each with other channels before you move budget.
If you track visits from AI assistants, our guide to ChatGPT referral traffic in GA4 shows how to read that source.
Landing page conversion rate
Landing pages are where paid and organic visits first meet your message. Calculate the same conversion rate for each landing page, and sort by sessions. A page with high traffic and a low rate is your first fix, and a heatmap or session replay on that page shows where visitors drop off.
Formula: landing page conversion rate = sessions on the page with a key event / sessions that started on the page x 100.
Qualified lead rate
Google Analytics and similar tools stop at the form. Join it to your CRM to see what the form became.
Formula: qualified lead rate = qualified leads / form submissions x 100.
Illustrative arithmetic: 20 / 80 x 100 = 25%. If one channel brings many submissions and few qualified leads, it is feeding the pipeline with noise. Our guide to revenue attribution explains how to credit the work that closed a deal.
Core Web Vitals
Slow pages lose visitors before analytics can describe them.
The Web Vitals guide on web.dev lists the targets for a good experience: Largest Contentful Paint within 2.5 seconds, Interaction to Next Paint of 200 milliseconds or less, and Cumulative Layout Shift of 0.1 or less, measured at the 75th percentile of page loads across mobile and desktop.
The three are known by their short names: LCP, INP and CLS.
Test key pages on a real mobile device, not only in a desktop browser. Then report the share of key landing pages that pass all three. Use it to decide which individual pages to fix first, because your website's performance shapes every other number in this list.
Web analytics tools answer different questions, so choose by the question
No single platform answers every question, and one platform should not try. Most B2B teams combine a few web analytics tools, each with a clear job:
- A page-tagging tool such as Google Analytics 4, or GA4, reports traffic sources, users, key events and landing pages, and is a common starting point for tracking visitor behavior and conversions.
- Session replay and heatmap tools show user behavior on one page: where people click, scroll and drop off.
- Testing tools compare two versions of a page, such as button placement or a checkout flow, so you change one thing at a time. A fix aimed at a real problem can lift conversion rates.
- Performance tools measure loading speed and Core Web Vitals on real devices.
- Your CRM connects the visit to the deal, which analytics tools alone cannot do.
Privacy focused analytics tools collect less personal data and often avoid third party cookies. A privacy focused setup also keeps personal data out of URLs and sets a shorter retention period. Weigh that against the reports you need. Whatever you pick, define each metric once, so every team reads the same number.
Build one web analytics dashboard that fits a single screen
A web analytics dashboard should answer the questions leadership asks every week, in the order they ask them. If it needs a guided tour, it has too many tiles. Start with the table below and add a tile only when someone will act on it.
A dashboard that connects metrics to business outcomes earns trust faster than one that lists every report.
| Question leadership asks | Dashboard tile | Where the data comes from |
|---|---|---|
| Is the right audience arriving? | Sessions and new users by channel | Acquisition report |
| Are they engaged? | Engagement rate by landing page | Landing pages report |
| Are they acting? | Key events and conversion rate | Key events column |
| Did the action become pipeline? | Qualified lead rate by channel | CRM joined to analytics |
| Is the site fast enough? | Share of pages passing Core Web Vitals | Page speed field data |
Google Analytics reports can feed it directly, and your CRM supplies the pipeline tiles. Keep a date range selector, a prior-period comparison and a note field for launches and outages, so a dip can be explained the day it appears.
Share the web analytics dashboard in a recurring email so nobody has to remember to open it.
A weekly, monthly and quarterly routine keeps website analytics useful
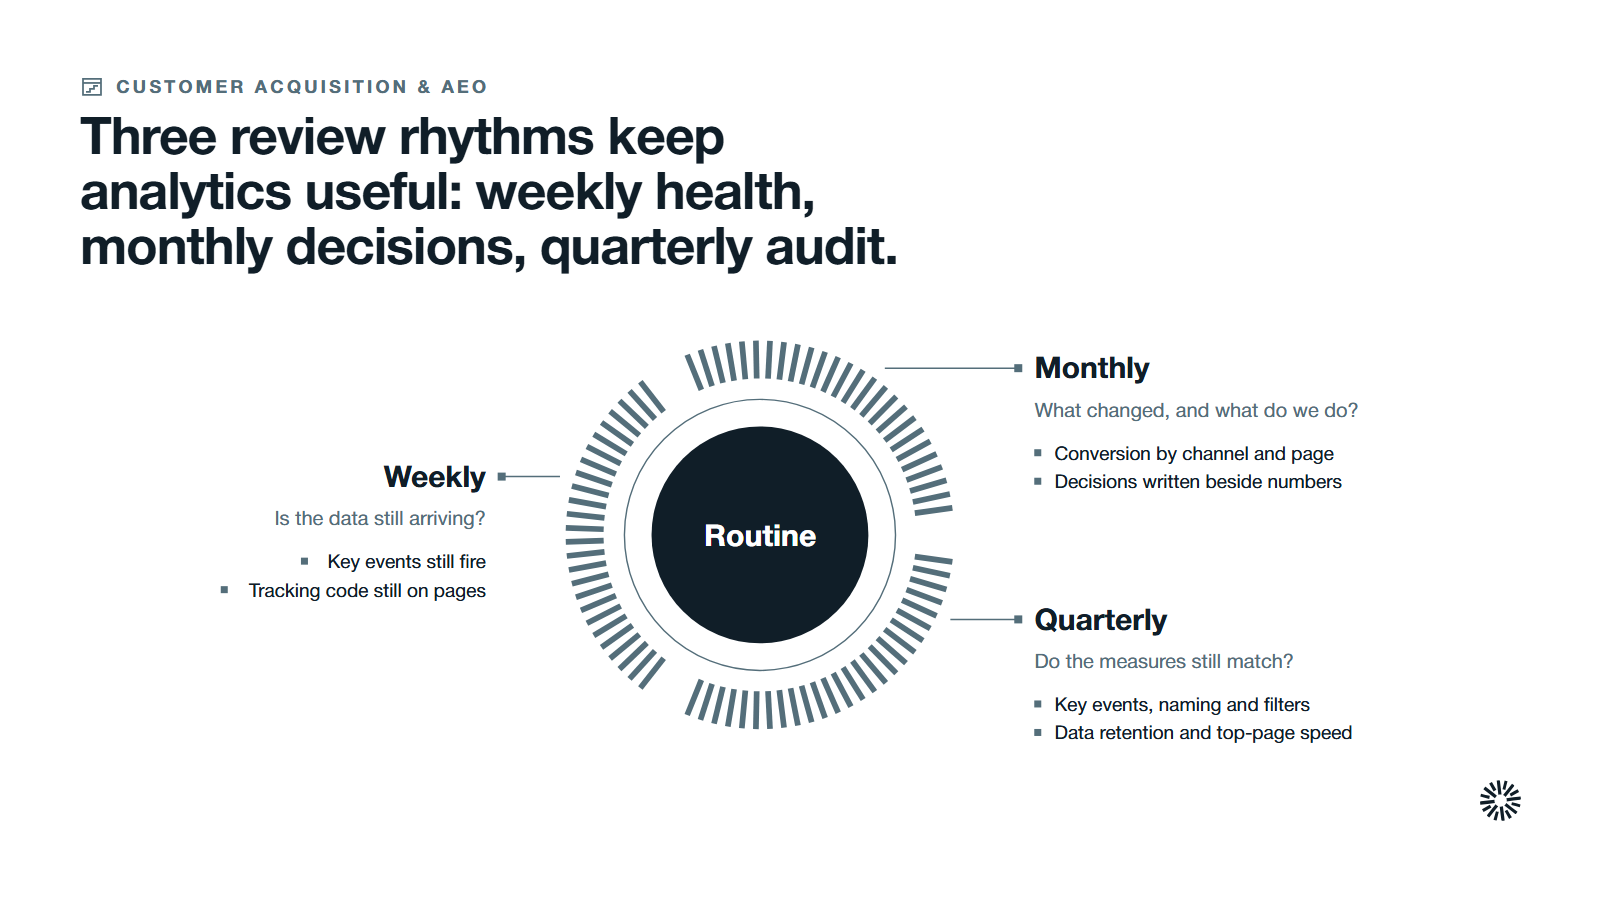
Small reviews on a fixed schedule beat a big cleanup after a bad quarter. Each rhythm has one question and one owner.
Weekly: is the data still arriving?
Spend fifteen minutes on health, not strategy. Open Google Analytics and check that the dashboard shows website activity today, that key events fired, and that no template change removed the tracking code.
Look at traffic trends against the last four weeks and note any launch, campaign or outage that explains a movement. If a number moved with no explanation, find the cause before you report it.
Monthly: what changed and what do we do about it?
Gain insight by reviewing conversion rate by channel and by landing page, engagement rate on your top pages and the qualified lead rate for the month.
Compare traffic trends month on month, find the largest drop off between landing page and form, and watch a handful of session replay recordings of your weakest page. Pick up to three changes: a page to rewrite, a channel to trim and a tag to repair.
Write the decisions next to the numbers. A report without a decision is a record, not a review.
Quarterly: do the measures still match the business?
Audit the foundations and decide which web analytics tools still earn their place. Review key event definitions, UTM naming, internal traffic filters, data retention and the Core Web Vitals of your top pages.
Compare the quarter's website-sourced pipeline with the figure your finance and sales teams hold, and explain the gap. Use the review to identify opportunities and adjust the marketing mix. Then ask whether your goals have changed, and retire any tile nobody used.
Common website analytics mistakes make good traffic look bad
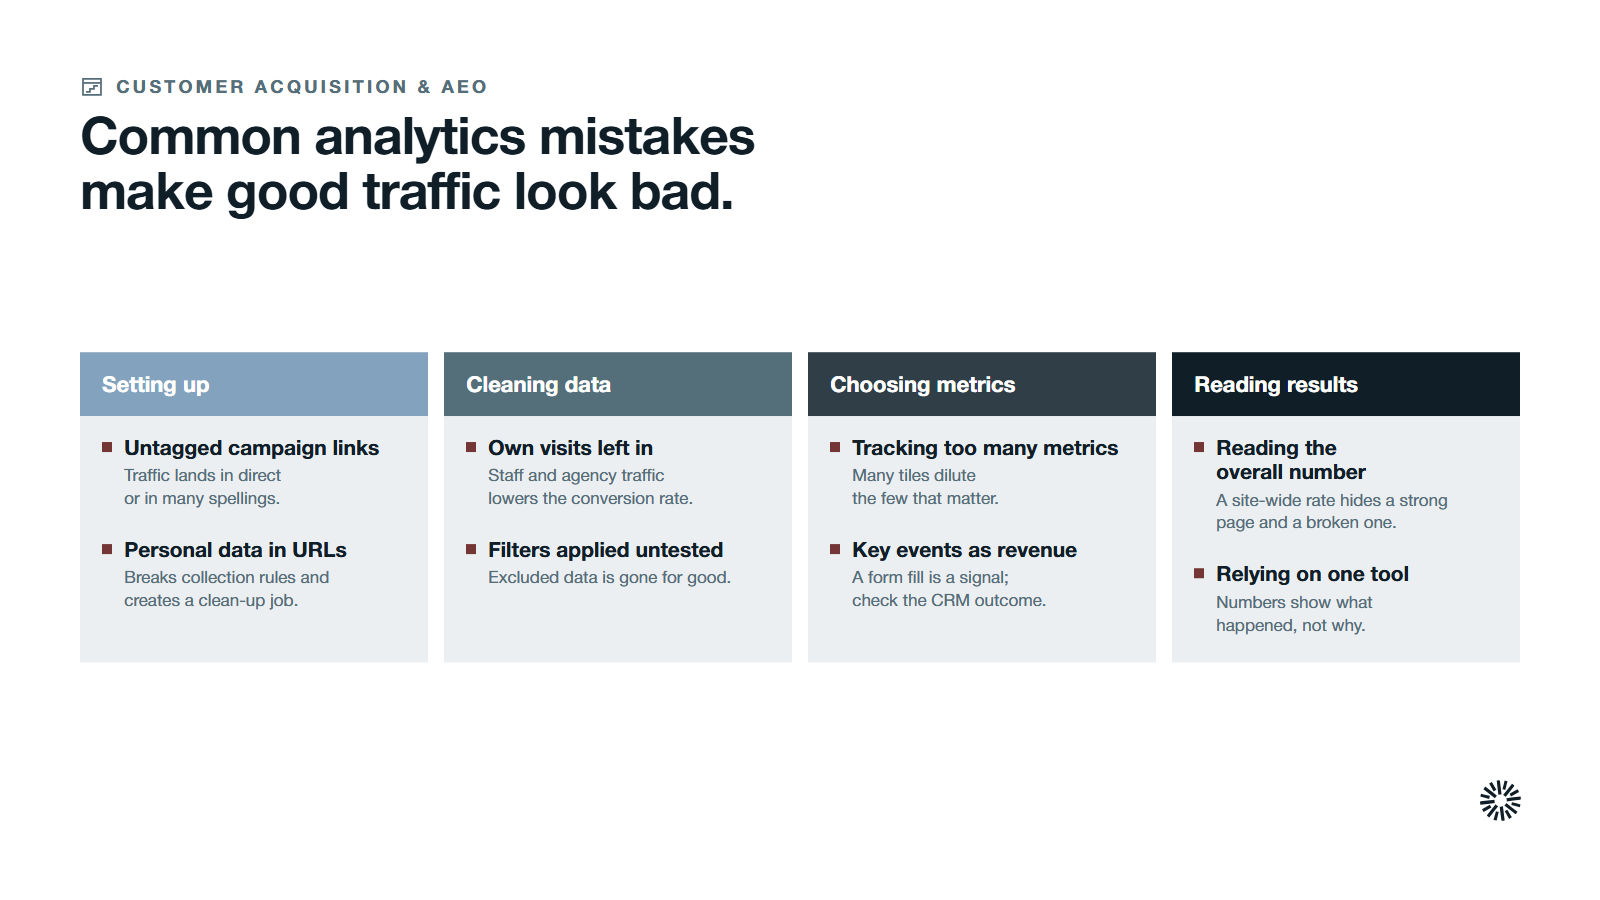
Most failures come from a handful of repeated mistakes.
- Tracking too many metrics. Twenty tiles dilute the three that matter, and nobody knows which to act on.
- Reading the overall number. A site-wide conversion rate hides a strong page and a broken one, so compare each single page with the site.
- Treating key events as revenue. A form submission is a signal. Check what it became in the CRM.
- Untagged or inconsistent campaign links. Traffic lands in direct or in a dozen spellings of one source.
- Leaving your own visits in the data. Staff and agency traffic raises sessions and lowers conversion rate.
- Applying a filter without a test. Excluded data is gone for good, so test a filter before activating it.
- Collecting personal data in URLs or parameters. It breaks the collection rules and creates a clean-up job.
- Relying on one of the analytics tools alone. Numbers show what happened, not why. Pair them with session replay, user interviews or a look at the page itself.
Remember also that consent shapes the data. Google's consent mode page explains that when visitors deny consent, tags send cookieless pings instead of storing cookies, and Google fills the gaps with conversion modeling and behavioral modeling.
A privacy focused configuration lowers risk but also changes what you can see. Treat every report as a good estimate, not a perfect count.
What you gain when this is done properly
When website data can be trusted, the debate about whether the site works becomes a review of numbers. Every team that touches the pipeline benefits.
Sales sees which pages warm up a buyer
Sales learns which pages and campaigns precede a good conversation, so follow-up starts with context about the customer journey. A rep can see that a prospect read pricing and a case page before asking for a call.
Marketing moves effort on evidence
Marketing sees which channels bring qualified leads, not just visits, and stops funding the ones that produce noise. Marketing efforts then follow business outcomes, and the insights are easy to defend when budgets are reviewed.
Web analytics helps justify marketing budgets with measurable impact, and reports to leadership use revenue terms, which protects the work that is paying off.
Customer success learns what buyers expected
Customer success gets insights into which promises the site made before the sale, and which help pages customers use after it. That shows where onboarding should start and which questions the site should answer sooner.
Make website analytics part of your go-to-market system
Website analytics is a chain of small decisions about tags, key events, naming and review, followed by a habit. Once the chain holds, the site can answer the question leadership keeps asking: what did it contribute to revenue this month?
Propello designs and builds connected go-to-market systems on HubSpot for CEOs and revenue leaders at growing B2B companies, using revenue operations to join marketing, sales and customer success data. If you want help making your analytics trustworthy, an audit is the place to start. For the full picture, read our complete guide to b2b website design.