If you lead marketing, sales or revenue at a B2B company, ABM metrics are how you find out whether your account-based marketing is working. The answer comes from measuring named target accounts, not from counting leads. Account based marketing metrics replace lead counts with measures of ABM effectiveness: coverage, engagement, buying group reach, meetings, opportunities, pipeline, revenue and win rate for each account.
This article is for CEOs, founders, CROs and marketing leaders who run an ABM program, or plan one, and cannot yet show what it returned. You will get a definition, a baseline, eight ABM metrics with formulas and illustrative arithmetic, a way to report them in HubSpot, and a weekly, monthly and quarterly review routine.
|
ABM Metrics ABM metrics are the measures that show how far each named target account has moved through your account-based marketing program, from first reach to closed revenue. |
Good ABM measurement ties every number to a named account
Traditional marketing metrics count people and clicks. Account-based marketing works on a fixed list of companies, so the unit of measurement changes. A form fill from a company that is not on your target account list tells you little about ABM success.
A team with working ABM measurement has five things in place:
- A written target account list, agreed by sales and marketing teams, with an owner for each account.
- An account tier for each company, so a one-to-one account and a programmatic account are not judged by the same bar.
- One shared definition of an engaged account, a qualified account and an opportunity.
- A baseline taken before the first campaign runs.
- A report that sales and marketing both trust and read on a fixed schedule.
These habits keep your ABM strategy tied to revenue growth. Whether you run a full account based marketing strategy or a small ABM program, the same ABM efforts need the same measures of ABM success. Key performance indicators work best when each has one owner. For the full picture, read our complete guide to account based marketing strategy.
If your list came from guesswork, fix that first. Our ideal customer profile template and our guide to defining your ICP, messaging, channels and sales motion show how to choose high value accounts on evidence. For a refresher on the approach itself, read what account-based marketing is.
Take a baseline before you track any ABM metrics
You cannot read a trend without a starting point. Before your ABM campaigns launch, record the same measures for the target accounts and, where you can, for a comparison group of non-ABM accounts of similar size and fit.
Record these once:
- How many target accounts are on the list, by account tier.
- How many already have at least one known contact, and how many are existing accounts that are customers today.
- How many open opportunities they hold, and the average deal size and sales cycle length of past deals with similar companies.
- The current win rate on comparable deals.
Add website visits from target accounts and event attendance, because they show target account engagement before sales interactions begin.
Treat the baseline as your own, not as an industry number. Published figures from other companies describe other markets. The comparison that matters is your target accounts now against the same accounts before, and against non-ABM accounts over the same period.
Eight account based marketing metrics follow target accounts from coverage to revenue
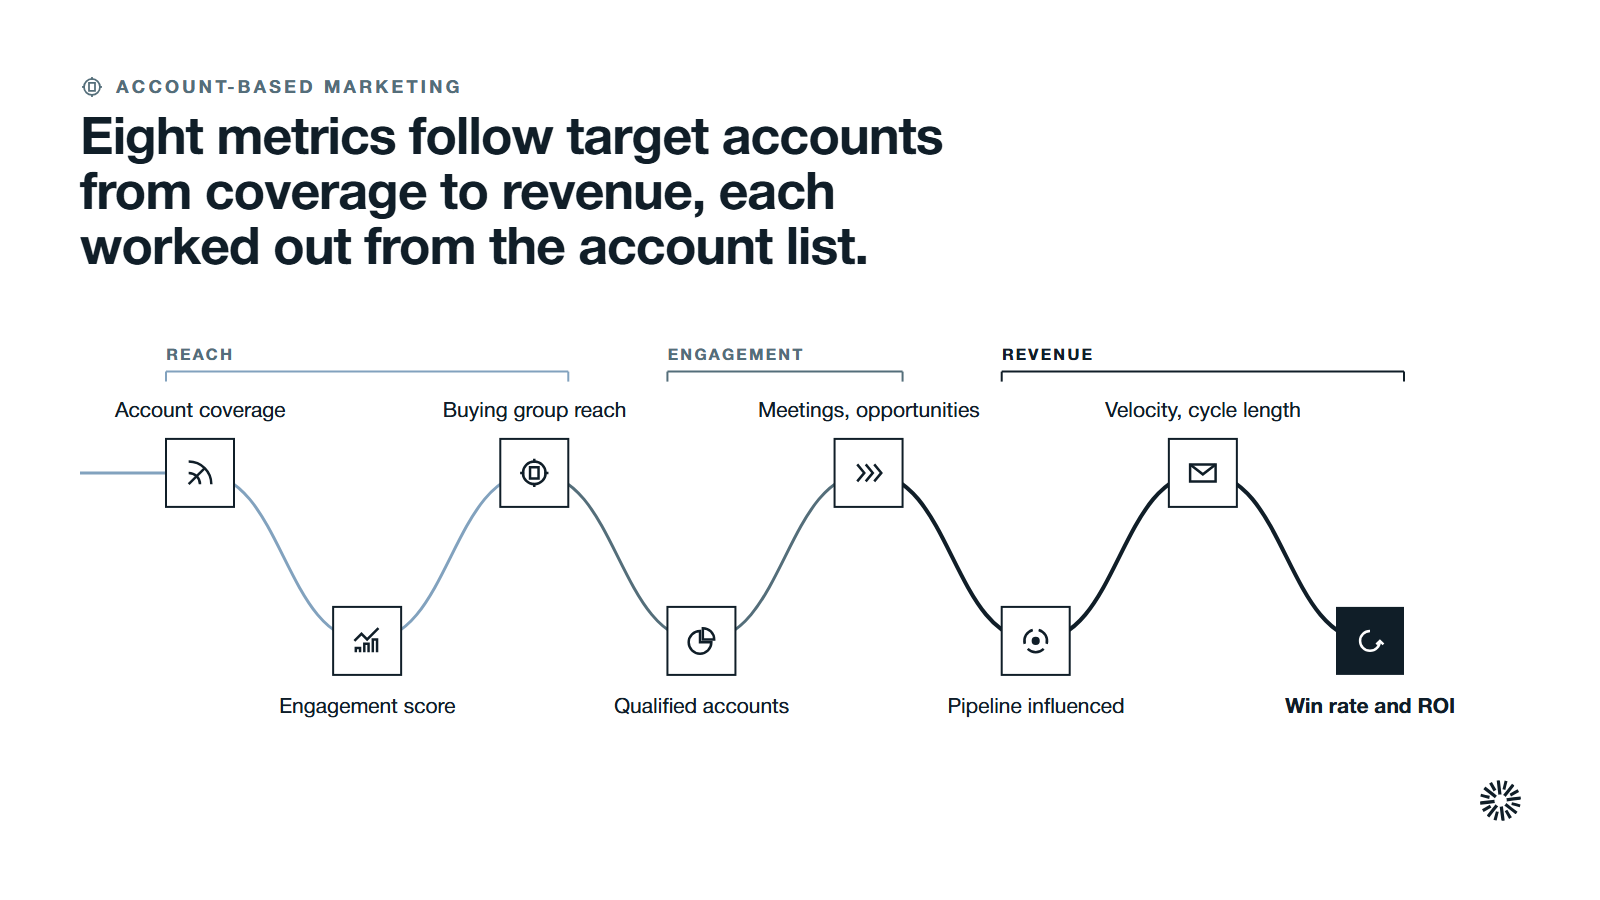
ABM KPIs fall into three groups: reach, engagement and revenue. The best ABM metrics are the ones your team will review every week. Work through them in order, because a revenue number cannot be explained until coverage and engagement are known. Use a small set of key metrics, and calculate each from the account list, not from lead counts. These ABM success metrics measure success at the account, not the campaign.
The arithmetic below uses one invented program and is illustrative, not a benchmark: 50 target accounts, 30 of them reached, 18 engaged, 12 buying roles engaged out of 20 mapped, 9 accounts with a meeting, 5 with an opportunity, $450,000 of pipeline, 2 closed-won deals of $90,000 each and 3 closed-lost.
Account coverage
Account coverage shows how much of your target account list your marketing and sales efforts have actually touched. An account counts as reached when at least one known contact has received a campaign touch or a sales outreach.
Formula: account coverage = target accounts reached / target accounts x 100
Illustrative arithmetic: 30 / 50 x 100 = 60%.
Low coverage usually means a data problem, not a messaging problem. Fix contact data before judging your ABM campaigns. Our guide to intent data explains how to spot which accounts are researching your category.
Account engagement score
Account engagement scores turn scattered activity into one number per account. Give each action a point value, add the points for all contacts at the account in a set window, and set a threshold for an engaged account.
Formula: engagement share = accounts at or above the threshold / target accounts x 100
Illustrative arithmetic: 18 / 50 x 100 = 36%.
Some teams call this account penetration rate. A low rate points to a messaging problem or a weak target account list, so read it beside coverage.
Account level engagement beats lead level engagement because one active contact and ten quiet ones is a different story from five active ones. Count website visits, event attendance, content downloads and email replies as target account engagement. Weight actions by how close they sit to a buying decision. Intent data from your own tools can feed the same score. A pricing page visit is worth more than a blog view, and a reply to sales outreach is worth more than an email open. Our guide to lead scoring covers how to set those weights.
Buying group reach
Buying decisions are made by groups. Forrester's State of Business Buying 2024 says on average 13 people within an organization are involved in the buying decision, and 86% of B2B purchases stall during the buying process. Reaching one contact is rarely enough.
Formula: buying group reach = buying roles engaged / buying roles mapped x 100
Illustrative arithmetic: 12 / 20 x 100 = 60%.
This is also called buying committee coverage: the number of unique stakeholders engaged per target account. A high engagement score is only convincing when it reflects several decision-makers, not one busy contact.
Map the roles for your top accounts first: the economic buyer, the user, the technical evaluator and the person who can block the deal. Reach that covers only one role often shows up later as a stalled opportunity. It also hides the buyer journey, because the buying journey inside a company involves people your campaigns never touched.
Marketing qualified accounts
A marketing qualified account is a target account that has crossed your engagement threshold and fits your profile. It is the account-level counterpart of a qualified lead, and it is the handoff signal for sales.
Formula: marketing qualified account rate = marketing qualified accounts / target accounts x 100
Illustrative arithmetic: 12 / 50 x 100 = 24%.
Agree the definition with sales before the first campaign. If sales rejects most of the accounts you pass over, your threshold is wrong. Our guide on turning intent signals into sales action shows how to route a qualified account to an owner quickly.
Meetings and opportunities from target accounts
Meetings and opportunities prove that engagement turns into sales conversations. Count only meetings with target accounts, and only opportunities created at those accounts.
Formula: meeting rate = target accounts with a meeting / target accounts x 100
Formula: opportunity rate = target accounts with an opportunity / target accounts x 100
Illustrative arithmetic: 9 / 50 x 100 = 18% for meetings, and 5 / 50 x 100 = 10% for opportunities.
Watch the conversion rates between stages too. Account progression rate shows how efficiently accounts move through buying stages, and funnel conversion rates compare that progress from one stage to the next. The ratio of meetings to opportunities shows whether the right people are in the room. A healthy ABM funnel converts accounts, not individuals, and its stages should match the sales funnel and sales process you already run.
Pipeline and revenue influenced
Pipeline is the value of open opportunities at target accounts. Revenue generated is the value of closed-won deals at those accounts. Influenced means the account had a counted touch before the deal; sourced means the touch created the opportunity. Report them separately, because mixing them inflates the program. Pipeline contribution compares the value of deals influenced at target accounts with the value in non-targeted segments, and average opportunity value shows whether tailored account campaigns change deal size.
Formula: pipeline coverage = open pipeline at target accounts / revenue target for those accounts
Illustrative arithmetic: $450,000 of pipeline against a $225,000 target gives coverage of 2.
Link the numbers to the buyer's path. Our guide to the B2B buyer journey explains which touches belong at which stage, and our revenue attribution article explains how to credit the work that closed the deal.
Pipeline velocity and sales cycle length
Pipeline velocity shows how fast value moves through the sales pipeline. ABM aims to shorten the sales cycle at accounts that matter, so compare target accounts with non-ABM accounts.
Formula: pipeline velocity = (opportunities x average deal size x win rate) / sales cycle length in days
Illustrative arithmetic: 5 opportunities x $90,000 x 0.4 / 100 days = $1,800 a day.
Deal velocity, the average time for a target account to move from engagement to a closed-won deal, tells the same story from the time side. Change one input at a time. A higher win rate, a larger average deal size or a shorter sales cycle each raise velocity, and the formula shows which one moved.
Account-level win rate and account-based ROI
Win rate at account level is the share of decided deals at target accounts that you won. It is the clearest test of whether account-based marketing changes the outcome.
Formula: account-level win rate = closed-won target accounts / (closed-won + closed-lost target accounts) x 100
Illustrative arithmetic: 2 / (2 + 3) x 100 = 40%.
Account-based ROI compares revenue with the total cost of the program, including media, content, data, tools and the time of the ABM team.
Formula: ABM ROI = (revenue generated - total cost) / total cost x 100
Illustrative arithmetic: ($180,000 - $60,000) / $60,000 x 100 = 200%.
A positive ROI means the account-based approach is profitable. Customer acquisition cost belongs here too. Divide the same total cost by new customers won. Revenue also continues after the first deal. Customer lifetime value tracks the long-term revenue target accounts generate after the sale. Track customer retention, customer lifetime and revenue growth at existing accounts as a separate line, since generating revenue from customers you already have is part of ABM success.
Report ABM metrics from target accounts in HubSpot
If your CRM is HubSpot, much of this reporting can sit on the company record. HubSpot's account-based marketing setup guide says the Target account property identifies the companies you are marketing and selling to as part of your account-based strategy. It adds that HubSpot has a library of dashboards and reports based on ABM properties.
HubSpot's page on the target accounts index says it is a centralized location for marketing and sales teams to monitor account progress. Its Analyze tab lists reports such as open target account pipeline, closed target accounts, target accounts by industry and target accounts with no buying roles.
That last report maps straight to buying group reach. Accounts with no buying roles recorded are accounts you cannot yet measure properly.
Marketing automation and logged sales interactions feed the same reports, if your team keeps them current. HubSpot's reporting is a starting point. The formulas above still need your own definitions of reached, engaged and qualified. Our guide on B2B demand generation shows where ABM reporting sits beside broader demand programs.
ABM metrics mislead when you ignore their limits
Every measurement system has blind spots. Name them so nobody mistakes a gap for a result.
- Small numbers swing. With 50 accounts, one deal moves win rate by many points. Read trends over quarters, not weeks.
- Long cycles delay revenue. A deal started this quarter may not close for a year, so early reviews rely on leading measures such as engagement and meetings.
- Influence is a judgment. Credit rules differ between teams. Publish yours and keep them fixed.
- Dark activity is invisible. Calls, events and conversations in private channels count only if someone logs them.
- No universal benchmark exists. Your account tier, deal size and market set the bar, so compare against your own baseline.
These limits do not make the numbers useless. They make the review routine more important than any single figure.
Common ABM measurement mistakes break the link to revenue
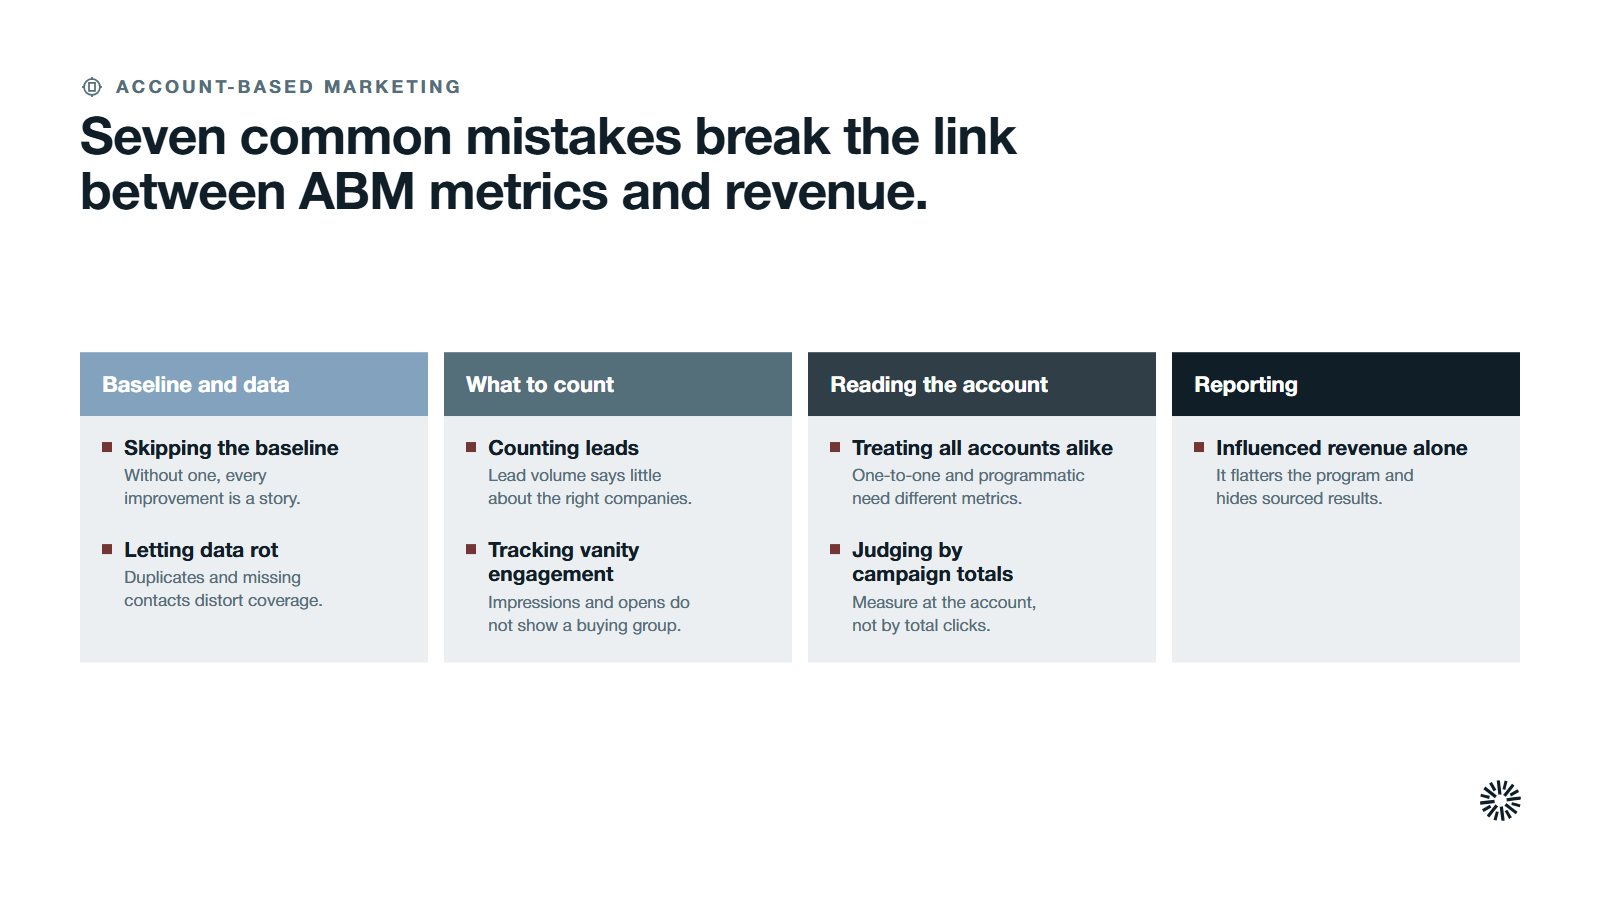
Most failures come from a few repeated mistakes.
- Counting leads. Lead volume says little about whether the right companies are moving.
- Skipping the baseline. Without one, every improvement is a story.
- Treating all accounts alike. A strategic one-to-one account needs different metrics from a programmatic one.
- Tracking vanity engagement. Impressions and opens do not show a buying group forming.
- Reporting influenced revenue alone. It flatters the program and hides sourced results.
- Judging ABM efforts by campaign totals. Marketing efforts should be measured at the account, not by total clicks.
- Letting data rot. Duplicate companies and missing contacts distort coverage and engagement.
A weekly, monthly and quarterly review keeps ABM metrics honest
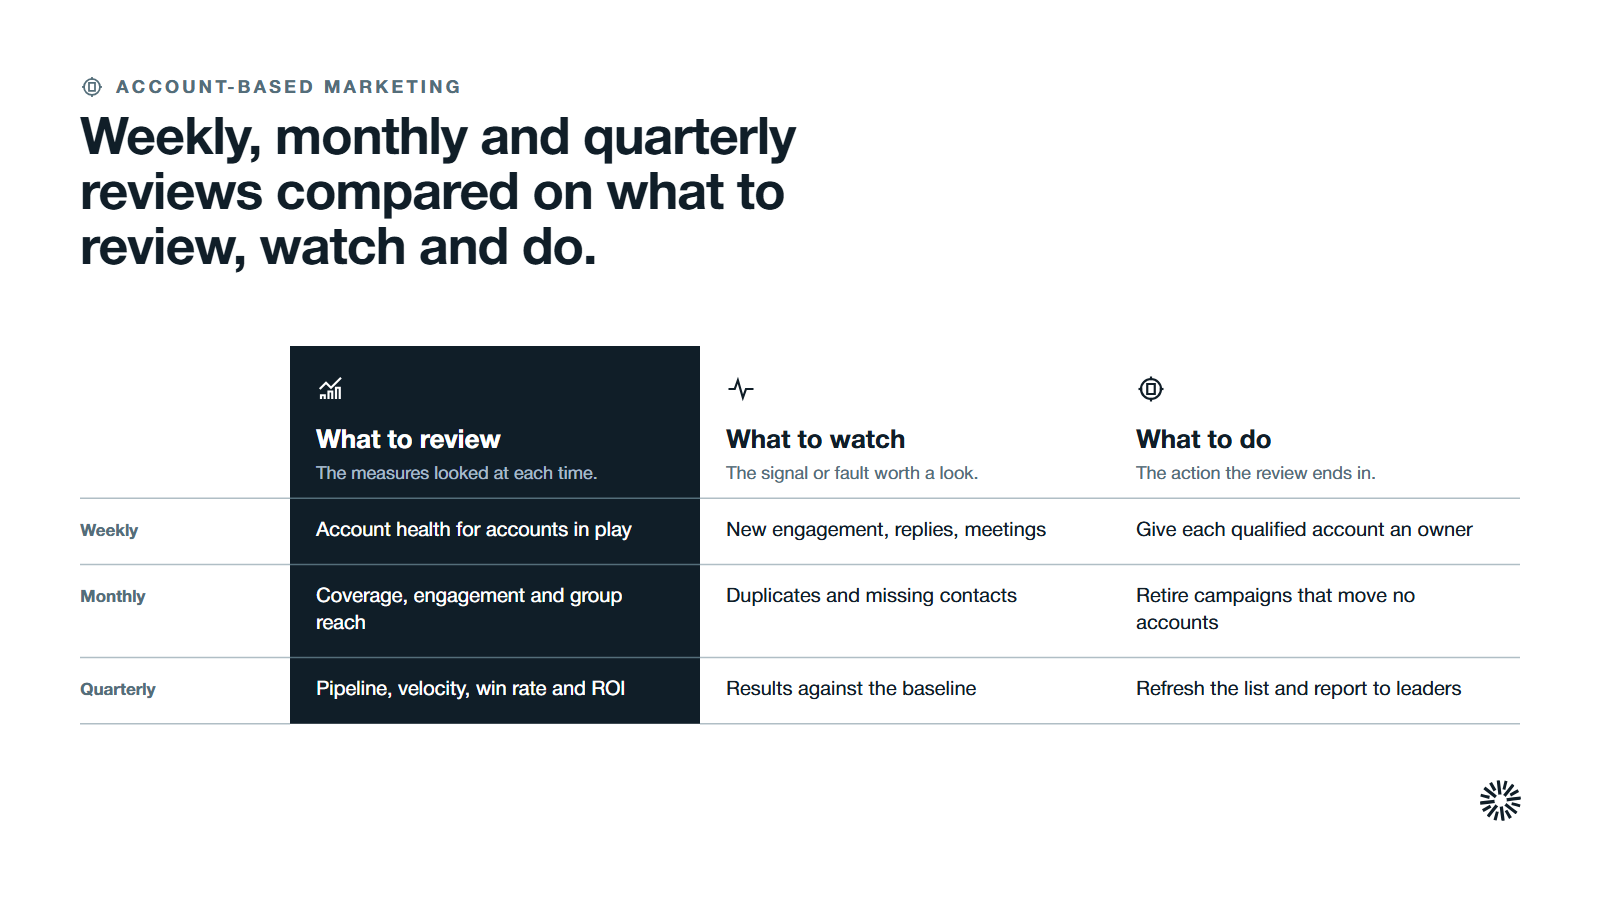
Small reviews on a fixed schedule beat a large cleanup after a bad quarter. They also let you measure success across marketing campaigns and marketing strategies that touch the same accounts. Keep the sales and marketing teams in the same meeting, with the same dashboard.
Weekly
Review account health for the accounts in play. Look at new engagement, accounts that crossed the threshold, replies to outreach and meetings booked. Assign every newly qualified account to an owner with a next step. This is the sales outreach check, and it should take under half an hour.
Monthly
Review coverage, engagement share, buying group reach and the marketing qualified account rate by account tier. Check data quality: duplicate companies, missing contacts and accounts with no buying roles. Compare opportunity creation with the plan, and retire campaigns that touch accounts without moving them.
Quarterly
Review pipeline, pipeline velocity, win rate and ABM ROI against your baseline and against non-ABM accounts. Refresh the target account list: promote accounts that progressed, demote the stalled ones and add new high value accounts. Revisit your thresholds and your ABM strategy, then report in revenue terms to leadership.
What you gain when this is done properly
When ABM metrics are tied to named accounts, the argument about whether the program works becomes a review of numbers. Each team benefits in a different way.
Sales sees which accounts to work next
Sales gets a short, ranked list of engaged accounts with the roles already reached. Reps stop chasing cold names and spend time where a buying group is forming. Our guide to B2B personalization shows how to tailor outreach once an account is warm.
Marketing moves budget on evidence
Marketing can see which channels and campaigns raise engagement at target accounts and which only add noise. Budget moves toward the first group. Reporting in pipeline and revenue also protects the marketing programs that work when budgets tighten.
Customer success learns which accounts are worth growing
Customer success sees which accounts engaged deeply before they signed, and which grew afterward. That points to expansion plays at existing accounts and to onboarding that matches what each buying group was promised.
Make ABM measurement part of your go-to-market system
ABM metrics work when they are a system: one account list, shared definitions, a baseline and a review habit. Without that system, the numbers arrive late and nobody trusts them.
Propello designs and builds connected go-to-market systems on HubSpot for CEOs and revenue leaders at growing B2B companies. If you want help turning your target accounts into a measurable program, an audit is the place to start. For the full approach, read the ultimate guide to ABM and our B2B account-based marketing examples.

/the-ultimate-guide-to-abm-share-1200x630-v2.png)