If you run revenue, marketing or customer success at a B2B company, you have probably seen a growth chart that bends upward and wondered why yours looks like a straight line. The gap between linear and exponential growth is the whole answer.
The short answer is that linear growth adds the same amount every period, while exponential growth adds the same percentage every period. A company that only acquires new customers grows close to a straight line. A company whose existing customers keep producing new revenue and new buyers can compound.
This article is for founders, CROs and marketing leaders who want a plain way to tell which curve they are on. You will see the two growth models side by side, a worked example with simple arithmetic, the evidence on why acquisition alone is getting harder, and the first steps to take this quarter. For the full picture, read our complete guide to growth model.
|
Exponential Growth Exponential growth is growth in which a quantity increases by the same percentage each period, so every period's gain is larger than the one before it. |
B2B growth is shifting from adding customers to compounding them
For years the default growth plan was simple: fill the top of the funnel, close more deals, repeat. Each month adds roughly the same number of new customers, and the chart climbs at a steady slope. That is a linear growth model.
The shift now under way is toward growth that builds on itself. The existing customer base becomes a source of retention, expansion, referrals and learning, and each of those feeds the next period's growth.
Propello calls this compound growth: the cumulative effect created when acquisition, retention, expansion, advocacy and continuous learning reinforce one another over time. Linear vs exponential growth is the math underneath that idea.
A short note on terms. In finance, compound growth usually means compound interest on money. Here it means the same compounding pattern applied to customers and revenue, where the mechanism is retention and expansion rather than interest.
What the dated evidence says about acquisition-led growth
Why would a team stop relying on acquisition alone? Two dated studies describe how hard the front door has become. Neither measures a growth rate. They describe the conditions that keep acquisition-led growth close to a straight line.
In its 2025 Buyer Experience Report, covered in a newsroom post dated November 12, 2025, 6sense found that 94% of buying groups ranked preferred vendors before first contact. Those groups ultimately purchased from that preliminary favorite 77% of the time.
On December 4, 2024, Forrester reported from its State of Business Buying, 2024 report that 86% of B2B purchases stall during the buying process. The same release said 81% of buyers express dissatisfaction with the provider they chose.
Read together, these say that new buyers form a favorite early, and many deals stall late. Winning each new customer takes a similar, hard-won effort every time. That is the signature of a constant rate of change.
Existing customers sit on the other side of that ledger. They already know you, so what they say, buy and renew shapes the next buyer's shortlist.
How linear and exponential growth differ
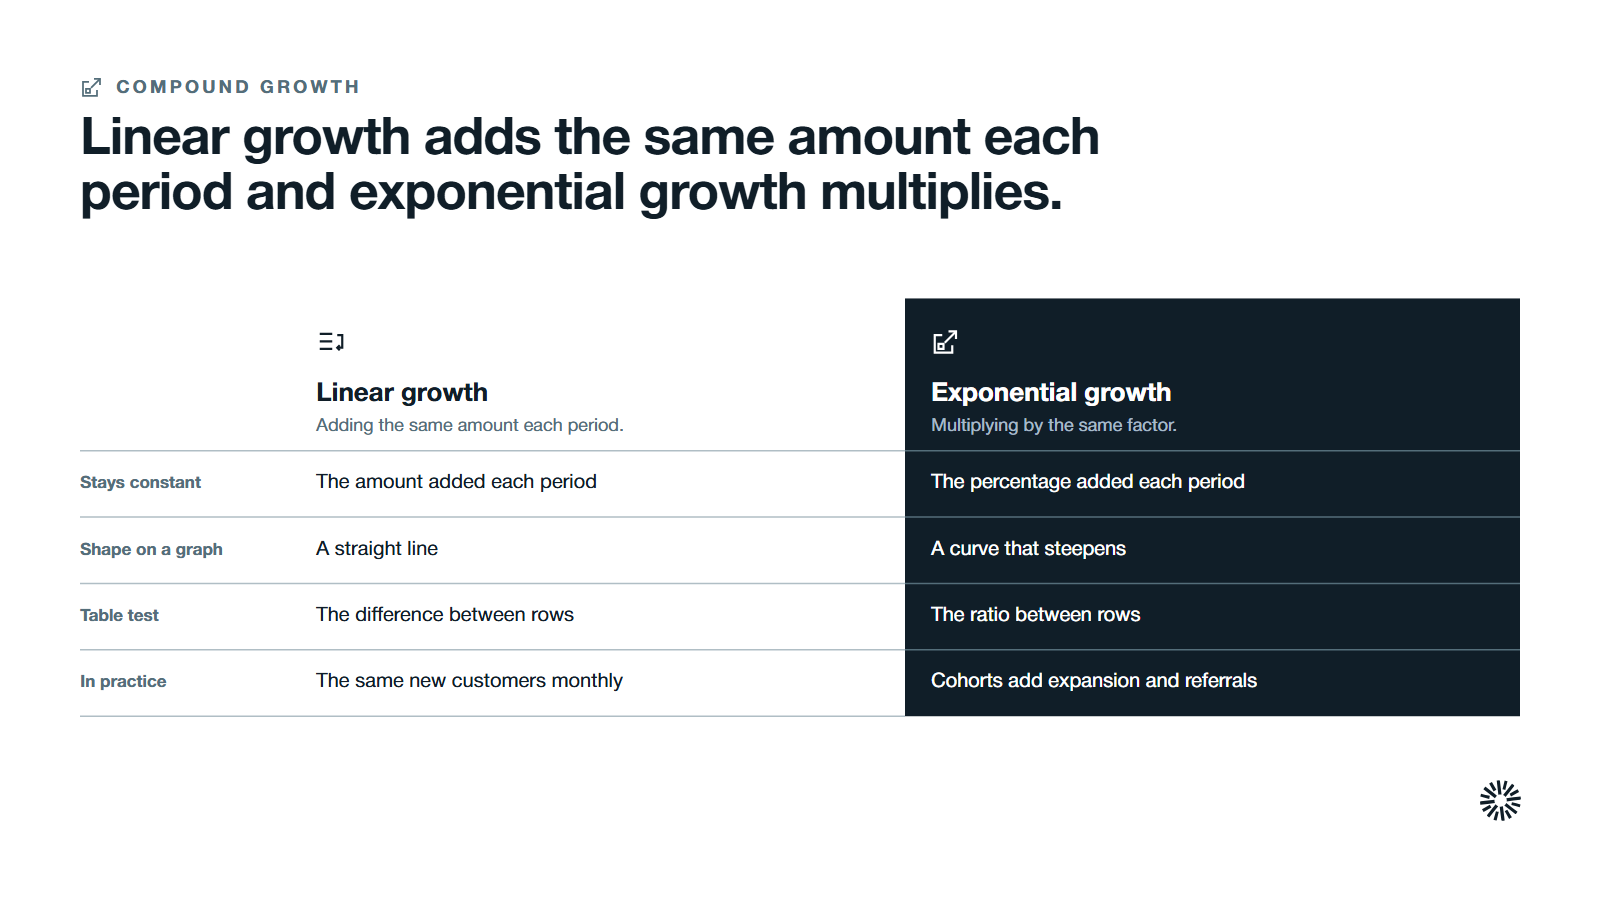
The two models differ in what stays constant. In a linear model the amount added each period is constant. In an exponential model the rate of growth is constant, so the amount added keeps getting bigger.
The classic textbook case is population growth. If a city's population grows by 2,000 residents every year, that is a linear relationship. If the population grows by three percent every year, each year's gain is larger because the initial population is multiplied again. Linear and exponential models describe both cases, and customer counts follow the same logic.
| Linear growth | Exponential growth | |
|---|---|---|
| What stays constant | The amount added each period | The percentage added each period |
| Shape on a graph | A straight line | An exponential curve that steepens |
| Formula | y = mx + b | y = a(1 + r)^t |
| B2B example | Adding the same number of new customers each month | Each customer cohort also produces expansion and referrals |
The linear growth model
A linear function has a slope, the rate of change, and a y intercept, the initial value. Hourly wages are the classic case: pay $20 an hour and earnings rise by $20 for every hour worked, no more and no less.
In the linear equation y = mx + b, m is the slope and b is the starting value. The relationship between time and total is a straight line. Doubling the time doubles the gain, nothing more.
A plant that gains the same number of centimeters each day follows the same pattern. So does a city that installs streetlights at a constant rate each week, a car that loses the same amount of value every year, or a budget that releases the same amount every month.
These linear changes happen by the same amount in each unit time, and a negative slope means the value decreases.
The strength of a linear model is that it reaches a target in a predictable manner.
The exponential growth model
An exponential function multiplies instead of adds. In y = a(1 + r)^t, a is the initial quantity, r is the growth rate per period and t is time. The term (1 + r) is the growth factor, the same factor applied every period.
Some texts write the same exponential growth model as y = a · b^x, where b is the growth factor.
Exponential growth multiplies by a constant percentage over equal time intervals. It starts slowly, then accelerates, and when graphed it forms a J-curve. The variable t stands for the number of intervals, and two variables, the starting quantity and the rate, are enough to describe the whole curve.
Exponential growth also describes national economic growth and inflation, and linear and exponential models matter in finance, science and everyday planning. Bacteria reproducing is the standard biology case, because every new cell divides again and the colony grows faster each hour.
A savings account is the textbook example of compound interest. Interest is paid on the balance, and then on the interest already paid, so the curve bends upward. The opposite case is exponential decay, where the same factor is below one and the value shrinks.
How to tell the two models apart from a table
To determine which model fits a set of numbers, compare two consecutive rows. In a linear model the difference between values is constant. In an exponential equation the ratio between values is constant, and that constant ratio, the common ratio, is the growth factor.
On a graph the same test is visual. A straight line points to a linear function. A curve that rises faster over time points to an exponential function. If the value decreases by the same factor each period, you have exponential decay.
To solve for the rate from two points, use the following formula: r = (current value / initial value)^(1 / t) - 1, where t is the number of time periods between them. A base that goes from 100 to 180 in 12 months gives a rate of about five percent a month.
A worked example with plain arithmetic
The numbers below are illustrative. They are not from any company, and they are not a forecast. They exist to show how the two models behave over time. Real world scenarios mix both, but a simple mathematical model makes the difference visible.
Imagine a business that starts with 100 customers. Compare two ways of growing for 36 months.
Linear: add five customers a month
In the linear case the business adds five customers every month and the base never produces anything on its own. After 12 months it has 160 customers. After 24 months it has 220. After 36 months it has 280.
The gain in month 36 is the same five customers as the gain in month one. The slope never changes.
Exponential: grow five percent a month
In the exponential case the base grows by five percent each month. In month one that is five customers, the same as the linear case, because five percent of 100 is five. That is the point: the first month looks identical.
The growth factor is 1.05, so the base after t months is 100 multiplied by 1.05 to the power of t. After 12 months the base is about 180. After 24 months it is about 323. After 36 months it is about 579.
| Month | Linear (add 5 a month) | Exponential (grow 5% a month) |
|---|---|---|
| 0 | 100 | 100 |
| 12 | 160 | 180 |
| 24 | 220 | 323 |
| 36 | 280 | 579 |
After a year the two models differ by only 20 customers. After three years the exponential case is more than twice the linear one.
Early on, the two models are hard to tell apart, which is why the question to ask is about the rate of change, not the current total. Given enough time, exponential growth will outpace linear growth, whatever the starting point.
Why acquisition-only growth stays close to a straight line
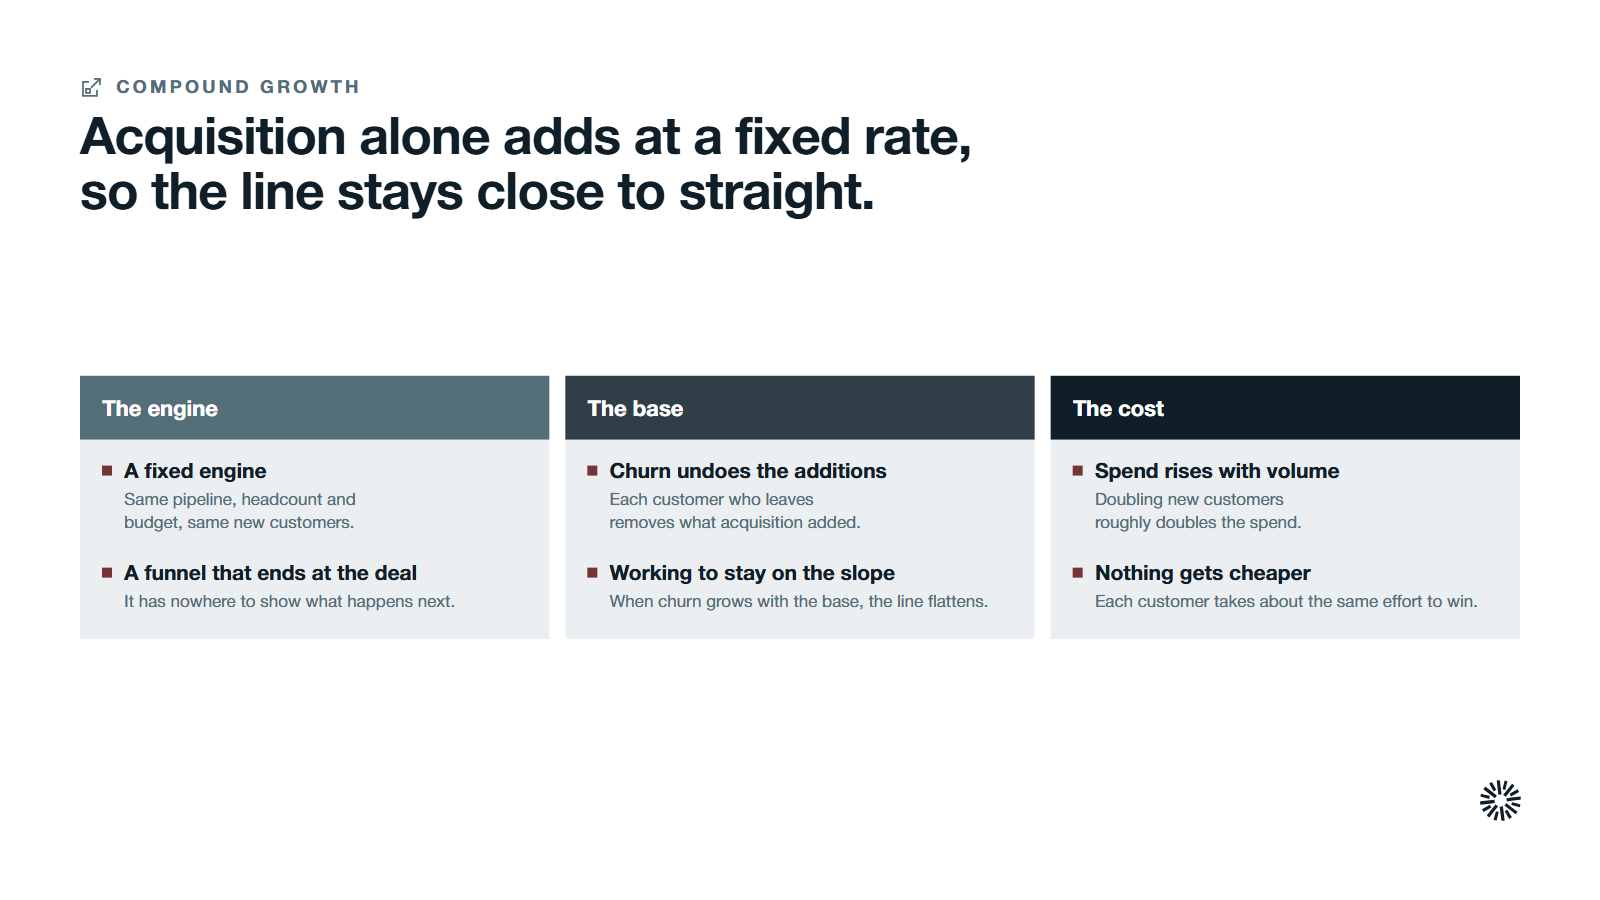
A team that only acquires cannot do better than a constant rate of change, because the engine is fixed. The same pipeline capacity, the same sales headcount and the same budget produce roughly the same number of new customers each month.
Leaks make it worse. Every customer who churns removes some of what acquisition added. When churn grows with the size of the base, the straight line flattens. The team works harder each quarter just to stay on the same slope.
The costs are linear too. Acquiring each customer takes about the same effort, so doubling the new customers per month means roughly doubling the spend. Nothing in the model gets cheaper with time.
This is also why a funnel picture can mislead. A funnel ends at a closed deal, so it has nowhere to show what happens next. Our comparison of growth loops vs funnels explains why a loop, where output feeds back into input, is the better picture for compounding.
How retention and expansion make the curve bend
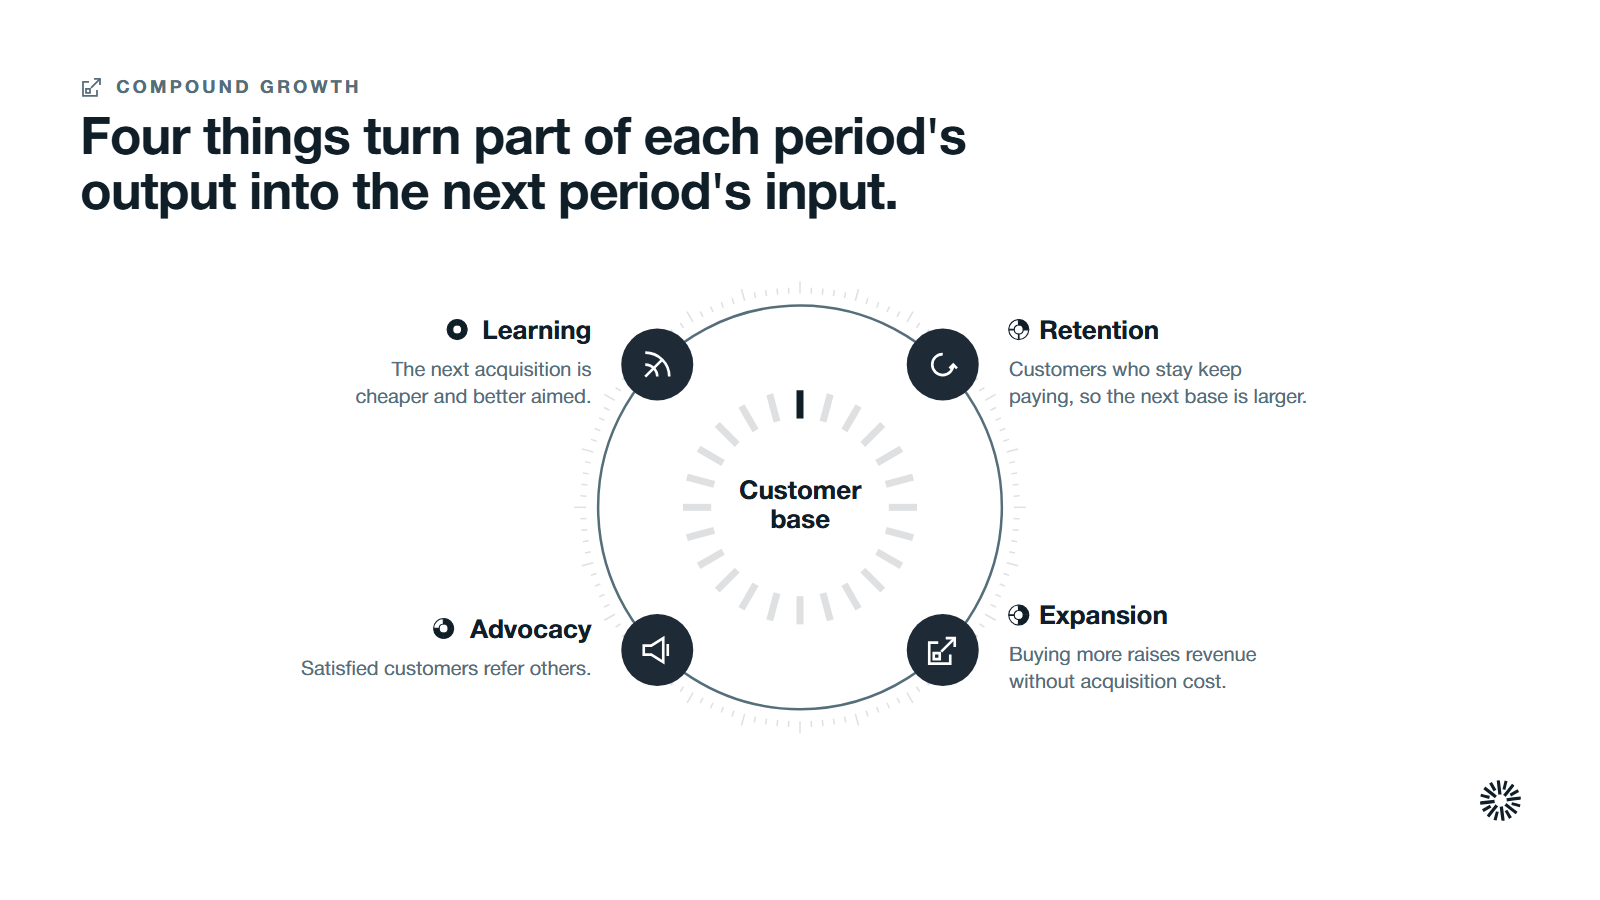
Compounding starts when part of each period's output becomes input for the next. In a B2B company four things do that work.
- Retention. A customer who stays keeps paying, so the base you start the next period with is larger. Our guide to reducing customer churn covers the causes and fixes.
- Expansion. A customer who buys more raises revenue without another acquisition cost. See our explainer on expansion revenue.
- Advocacy. Satisfied customers refer others and shape the early shortlist described above.
- Learning. What you learn from customers makes the next acquisition cheaper and better aimed.
Each of these acts like a growth rate applied to the existing base, not a fixed number added. That is what turns a straight line into an exponential curve.
You do not need to grow five percent a month for this to matter. Even a modest rate, applied every period to a base that does not leak, outruns a fixed number of additions given enough time.
Where the exponential analogy breaks
The math is clean. Real companies are not. Four limits keep the analogy honest.
First, markets are finite. A constant percentage cannot continue forever, because a company eventually runs out of buyers who fit. Real growth often follows an S shape, steep in the middle and flattening near the ceiling. Biologists call that ceiling carrying capacity, and growth that starts exponentially bends into logistic growth as resources run short.
Second, the rate is not constant. Growth rates drift as a company gets bigger, as customers mature and as competitors respond. Treat r as something you measure each period, not a promise.
Third, costs compound too. Support, onboarding and account management scale with the base, so the same factor that grows revenue can grow cost.
Fourth, the early data is noisy. In the first year a small base makes every ratio swing. A single large customer can look like a trend.
What this means for revenue teams
The practical point is that you should know which curve each part of your growth sits on. Understanding growth patterns in this way helps you project what the next four quarters can represent in revenue, and where the plan depends on a rate that has not been proven.
New-logo acquisition is mostly linear. Output follows capacity, and capacity follows budget and headcount. That is fine, as long as you plan for it that way.
Retention, expansion and referral are where growth can compound. They depend on the base you already have, so their output grows as the base grows. A team that measures only new customers per month cannot see them working.
Reporting alone will not settle this. You need the same definitions of a customer, a renewal and an expansion across sales, marketing and customer success. Our guide to the marketing flywheel vs funnel shows where the two pictures disagree.
What to do first this quarter
You can test your own position in four steps, using data you already have.
- Split revenue by source. Group last year's revenue into new customers, renewals and expansion. Done looks like one table with three rows and a total.
- Find the rate, not just the total. For each source, calculate the percentage change from the previous period. Done looks like a growth rate for each row, not only a dollar figure.
- Check for leaks. List customers lost and revenue lost to downgrades for the same period. Done looks like a number you can subtract from the first table.
- Pick one loop to strengthen. Choose retention, expansion or referral, whichever is weakest, and name an owner. Treat it as an investment with a review date. Done looks like one named owner and one date for the next review.
Repeat the table every quarter. After a few quarters you can see whether the base is contributing growth or only being replaced.
What you gain when this is done properly
What sales gains
Sales stops carrying the whole growth plan on new logos. Warm expansion conversations and referrals sit alongside new pipeline, so quota planning reflects where revenue really comes from.
What marketing gains
Marketing gets a reason to serve customers as well as prospects. Content, events and proof from existing accounts become inputs to the next period's growth, and that work is measured against revenue instead of clicks alone.
What customer success gains
Customer success becomes part of the growth engine rather than a cost line. Healthy accounts show up as the starting base for the next period, which makes the case for investing in onboarding and adoption.
From a straight line to a curve
The difference between linear and exponential growth is not about ambition. It is about whether the output of one period feeds the next. Add customers and you get a line. Build a system where customers produce more customers and revenue, and you get a curve.
Propello designs and builds connected go-to-market systems on HubSpot. If you want to see which of your growth sources are linear and which can compound, a GTM Audit is the place to start. Propello is a HubSpot partner.