If you run revenue at a growing B2B company, you need one number that says whether your existing customer base is growing or shrinking. Net revenue retention is that number. It shows how much recurring revenue you keep and grow from the customers you already have, before a single new customer is counted.
This article is for CEOs, founders and revenue leaders. It explains what net revenue retention means, how to calculate it with a worked example, what moves it up or down, and how to read the result, so you know what to ask your sales, marketing and customer success teams next.
|
Net Revenue Retention Net revenue retention is the share of recurring revenue you keep from a group of existing customers after a set period, counting upgrades and add-ons and subtracting downgrades and cancellations. |
How net revenue retention works
Net revenue retention (NRR), also written as the net revenue retention rate, looks at one fixed group of customers: the ones who were paying you at the start of the period. It then asks how much those same customers pay you at the end. New customers who joined in between are left out on purpose.
That makes NRR a clean read on the health of your existing customer base. Net revenue retention is a headline measure for any SaaS business or other subscription business that bills on a recurring basis.
Total revenue can rise because you signed new customers while your current customers quietly shrink. NRR separates the two, so a strong sales quarter cannot hide a leaking customer base.
SaaS Capital's 2025 retention research defines net retention as the monthly recurring revenue in December 2024 coming only from customers who were customers in December 2023, divided by total monthly recurring revenue in December 2023. It adds that NRR can be anything from 0% to well above 100%, because it includes upsells, cross-sells and price increases.
Some teams call the same measure net dollar retention or the net retention rate. The names differ, the logic is the same: recurring revenue kept and grown from the same customers over time.
A short note on the word itself. In everyday speech, to churn means to stir or agitate. In this article, churn means customers, or the revenue they pay, leaving the business.
How to calculate net revenue retention
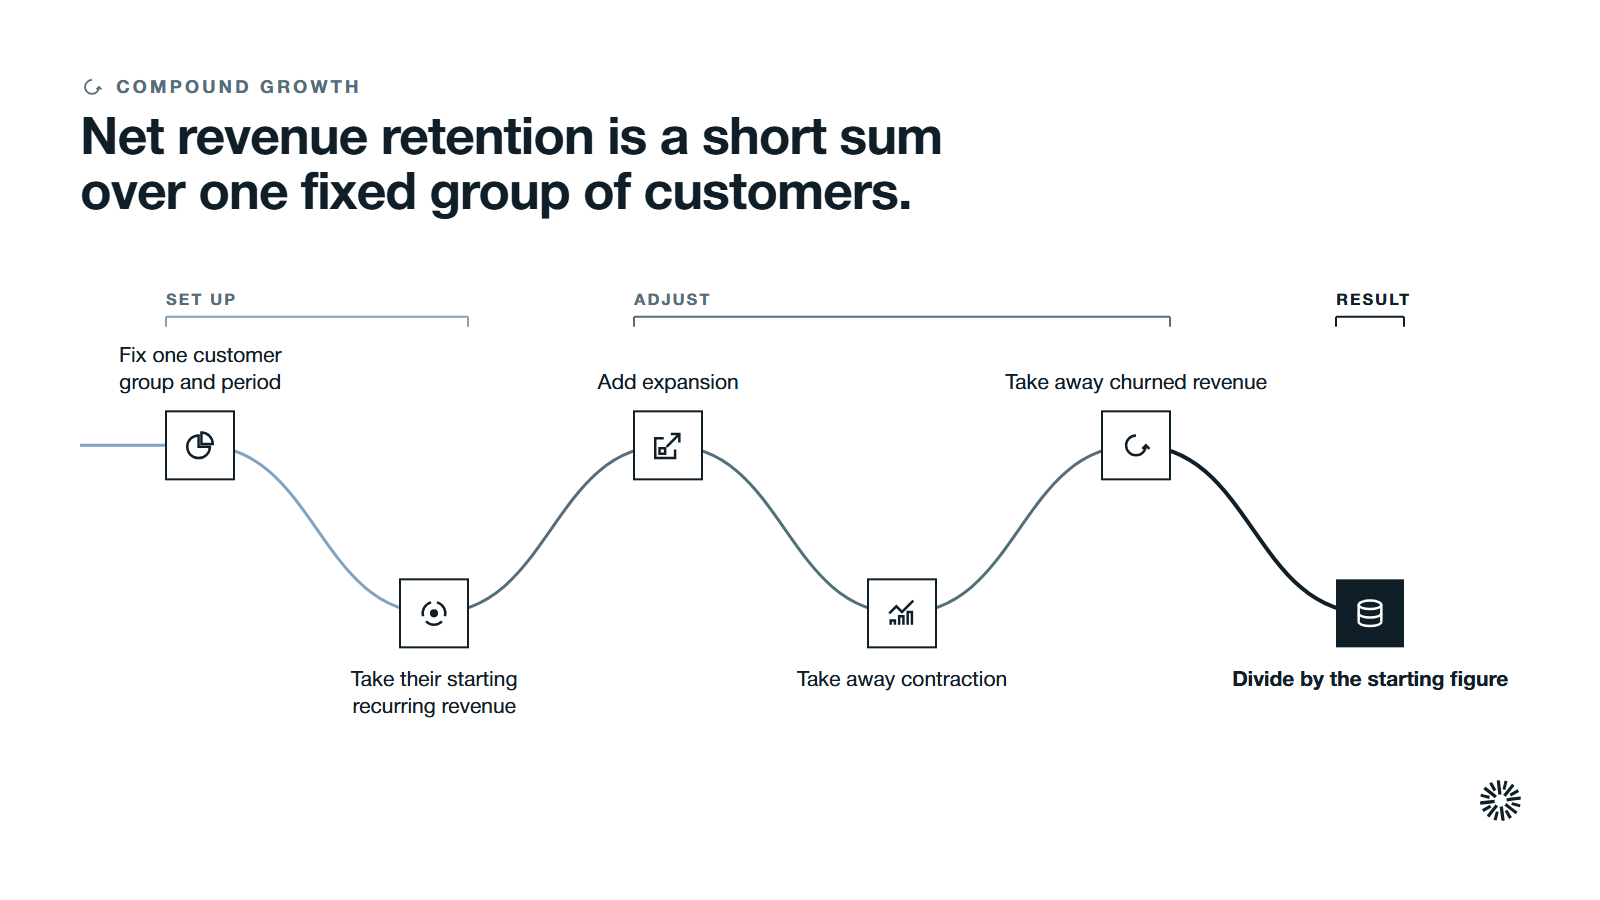
You calculate net revenue retention by starting with the recurring revenue of your customers at the beginning of a period, adding expansion, and subtracting contraction and churn. Then you divide by the starting figure.
Net revenue retention = (starting recurring revenue + expansion - contraction - churned revenue) / starting recurring revenue
Here is illustrative arithmetic, not a real result. Say your existing customers pay $100,000 in monthly recurring revenue at the start of the year. Over the year, upgrades, add-ons and cross-sells add $15,000. Downgrades remove $4,000. Cancellations remove $6,000.
Your recurring revenue from those same customers is now $105,000 ($100,000 + $15,000 - $4,000 - $6,000). Divided by the starting $100,000, the net revenue retention rate is 105%.
Three rules keep the number honest:
- Use the same group of customers at both ends of the period.
- Count only recurring revenue. Leave out setup fees and other one-time charges.
- Pick one period, usually twelve months, and keep it fixed so you can compare year to year.
Many teams use the net revenue retention formula in a spreadsheet or a billing report, and the result only means something when the inputs are clean.
You can run the calculation monthly, quarterly or annually. The formula stays the same and only the period changes. Whichever period you choose, write it down, because a rate quoted without its period cannot be compared with anything.
What moves net revenue retention up or down
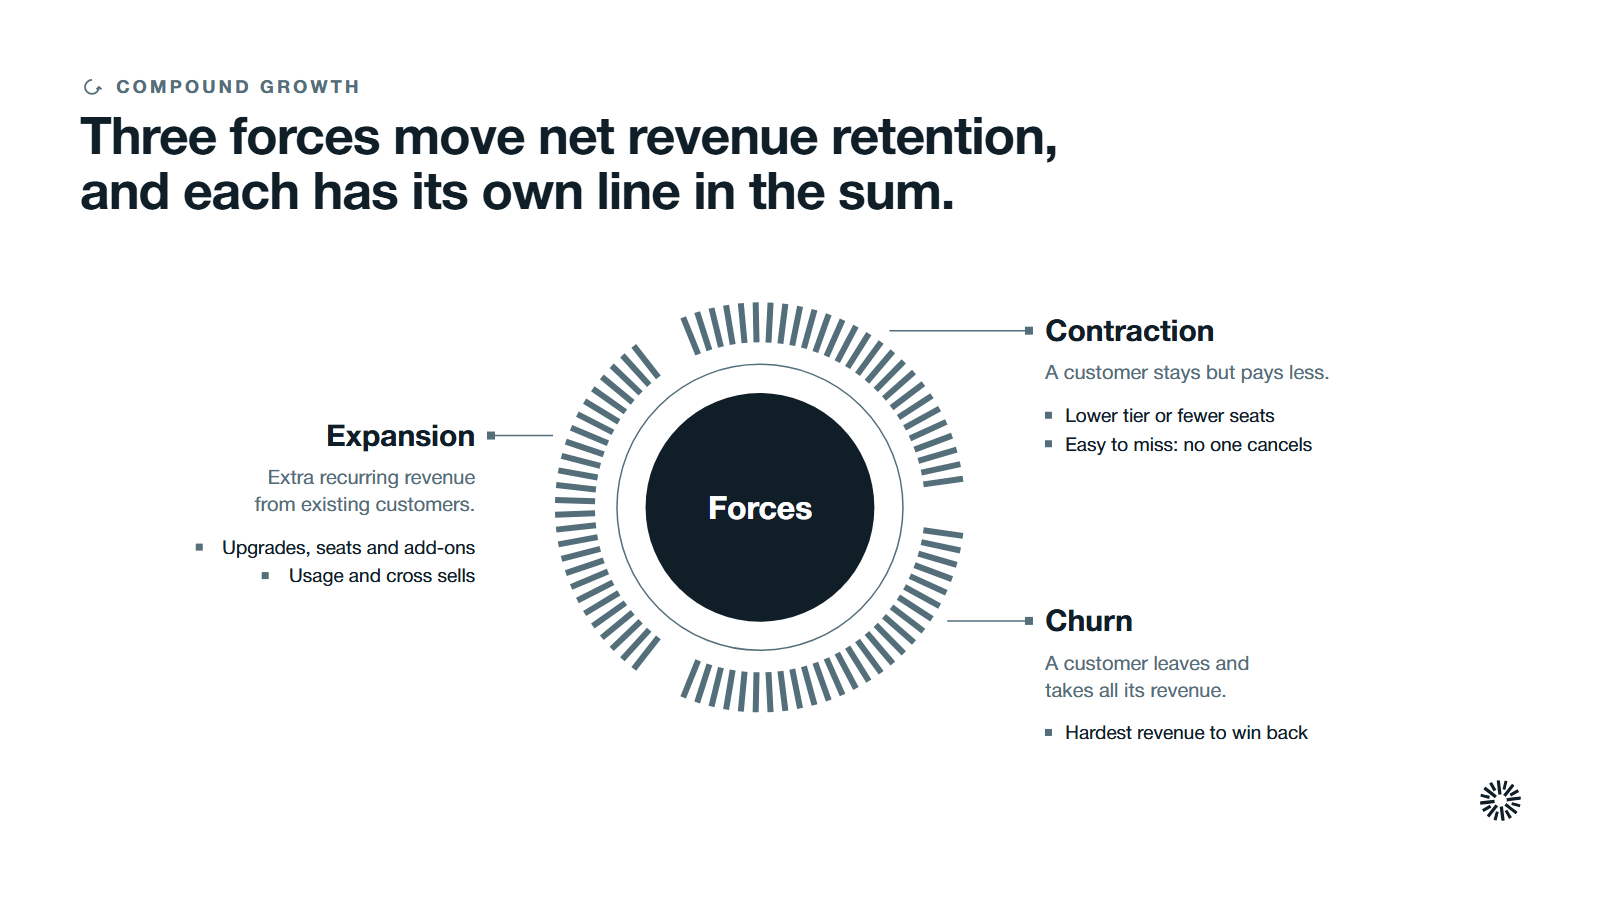
Three forces move the number, and each has its own line in the calculation. Two change what customers pay, and one removes customers altogether.
Expansion revenue lifts net revenue retention
Expansion revenue is the extra recurring revenue that existing customers give you through upgrades, extra seats, higher usage, add-ons and cross sells. It is the only force that can take the rate above 100%. To calculate expansion revenue, add up the increases in monthly recurring revenue from existing customers during the period and leave out new customers.
The skill is to identify expansion opportunities early. Look at customer engagement and usage: a team nearing a usage limit, or one department using a feature heavily, is a signal. Group accounts into customer segments by size and use case to see which have room to grow. Packaging and pricing strategies then give those accounts an obvious next step.
When expansion is larger than everything you lose, the same customers pay you more than they did a year ago. The same logic helps you expand customers without adding acquisition cost. That is the idea behind net negative churn: expansion outweighs churn, so the customer base grows on its own.
Contraction takes revenue without losing the customer
Contraction happens when a customer stays but pays less. They move to a lower tier plan, remove seats or cut usage. The logo is still on your list, but the lost revenue shows up in your net revenue retention immediately.
Contraction is lost revenue that never shows up as a cancellation. It is easy to miss because no one cancels. Track it as its own line, so a quietly shrinking account does not hide behind a healthy customer count.
Customer churn removes the whole account
Customer churn is a customer leaving entirely. Every churned customer takes their full recurring revenue out of the calculation, and that revenue is the hardest to win back because the relationship has ended.
A smooth renewal process helps, because reminders and clear terms stop accidental churn from missed renewals. Flexible pricing options also give a customer a smaller step down than leaving.
If churn is your main problem, the fix sits earlier in the journey. Our guide on how to reduce customer churn covers the causes and the early-warning signs.
Net revenue retention vs gross revenue retention
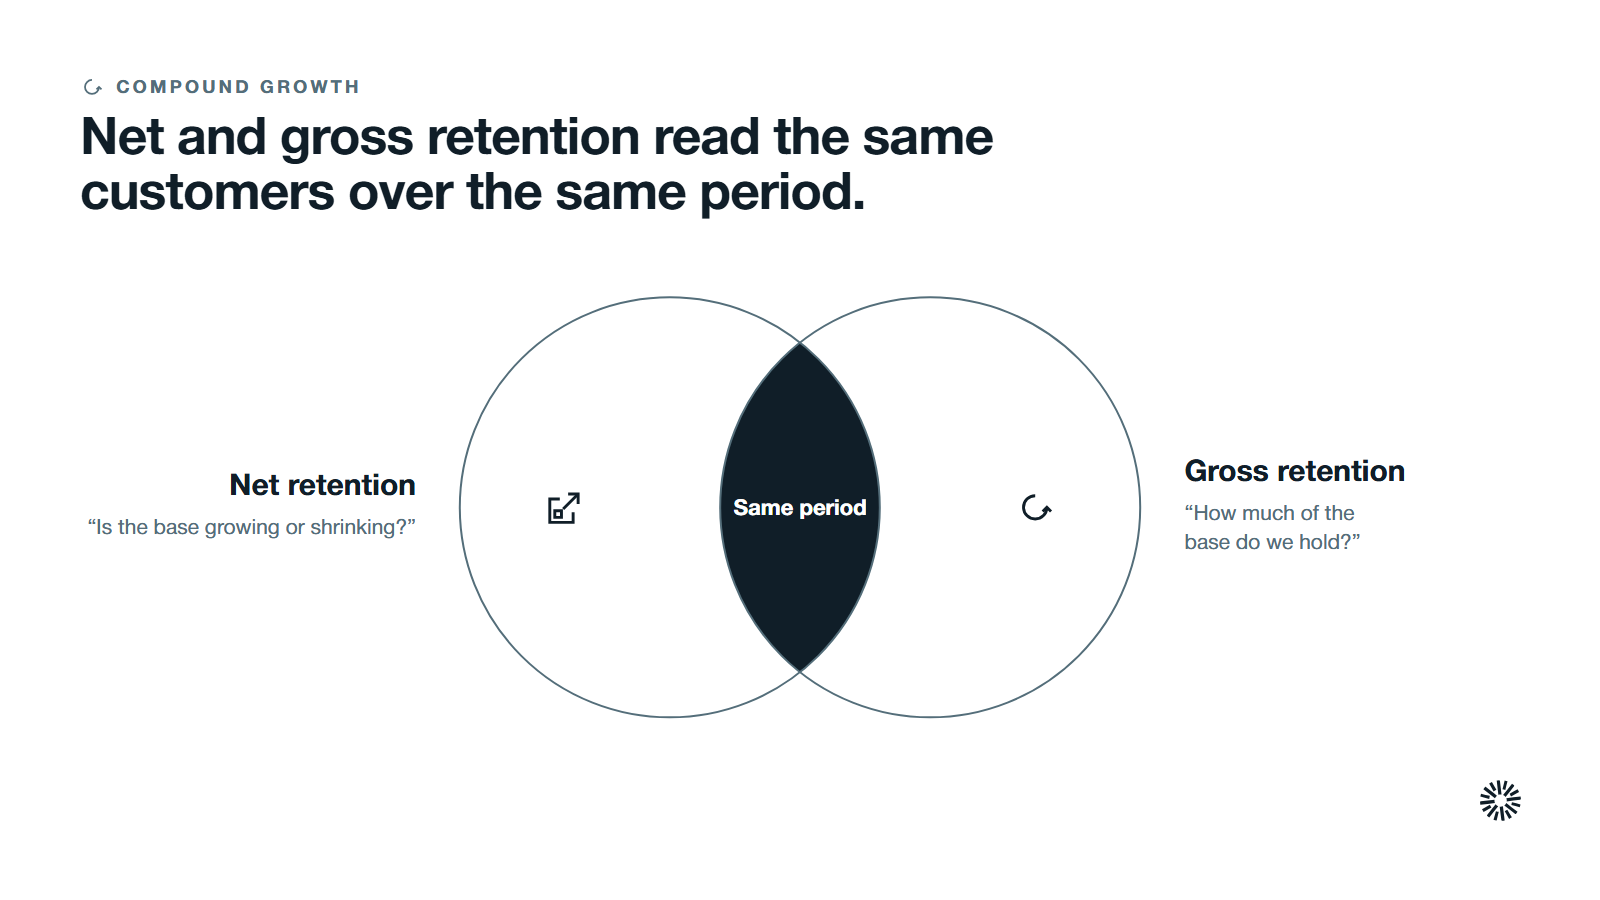
Gross revenue retention (GRR) is the nearest neighbor of NRR, and the two are read together. They use the same customers and the same period. The difference is what each one counts.
Gross revenue retention, also called gross retention, ignores expansion. SaaS Capital describes it as the same formula excluding upsells, cross-sells and price increases, which means GRR can never exceed 100%.
How to calculate gross revenue retention
To calculate gross revenue retention, keep the same customer group and subtract only what you lost. The gross revenue retention formula is: (starting recurring revenue - contraction - churned revenue) / starting recurring revenue. That leaves the recurring revenue retained from the group. Using the same example, ($100,000 - $4,000 - $6,000) / $100,000 gives a GRR of 90%.
| Gross revenue retention | Net revenue retention | |
|---|---|---|
| What it counts | Revenue kept after contraction and churn | Revenue kept, plus expansion |
| Highest possible value | 100% | Well above 100% |
| Question it answers | How much of the base do we hold? | Is the base growing or shrinking? |
| Example from above | 90% | 105% |
Read the two together. A high NRR with a low GRR means expansion is covering for customers who leave, which is fragile. A high GRR with a flat NRR means customers stay but nobody buys more.
NRR also differs from logo retention, which counts customers rather than dollars. Logo retention can look healthy while revenue falls, because it treats a small account and a large one as equal.
How to read your net revenue retention rate
An NRR of 100% means expansion exactly offsets contraction and churn. Below 100%, your existing customer base is shrinking, and new sales have to fill a hole before they add growth. Above 100%, your current customers are growing your revenue before you sign anyone new. For the full picture, read our complete guide to growth model.
An NRR above 100% is generally read as healthy, because it shows existing customers finding more value in what you sell.
What a good net revenue retention rate looks like
There is no single good number. It depends on your contract size, market and stage. SaaS Capital's annual survey of private B2B companies is a useful reference for net revenue retention benchmarks.
SaaS Capital's 2025 research found that for companies with annual contract values of $25,000 to $50,000, the median NRR is 102%. The top quartile reported 111% and the lowest quartile reported 97%.
The same page reports that higher net retention correlates with higher annual contract values, so compare yourself with SaaS companies selling at a similar price point.
What 120% net revenue retention means
An NRR of 120% means that for every $100 of recurring revenue a group of customers paid a year ago, that same group now pays $120. Expansion has outrun all churn and contraction by 20 points.
What 100% net revenue retention means
An NRR of 100% is the break-even line. You gained as much from existing customers as you lost, so the base is flat. It is not a failure, but it means all your growth must come from new customers, which puts all the weight on acquisition.
Net revenue retention and revenue growth
SaaS Capital also reports that, across its survey sample of companies with more than $1 million in annual recurring revenue, the median growth rate was 24%.
Its page states that the growth rates for groups of companies with NRR of at least 110% were higher than the population median, and the growth rate for companies with NRR below 100% was lower. Retention and growth move together, though the page does not prove one causes the other.
How net revenue retention connects to your customers
Net revenue retention is a result, not an activity. You cannot manage the percentage directly. You manage the things underneath it, and the customer success team sits closest to most of them. Strong customer success work, including onboarding and regular check-ins, belongs inside your retention efforts.
Health, onboarding and adoption decide whether a customer renews. Product fit and timing decide whether they expand. Pricing and packaging give a growing customer a next step, such as a higher tier or an add-on.
Good customer retention shows up first in GRR, and customer loyalty shows up in NRR as expansion. If customer satisfaction is strong but NRR is flat, the next question is whether customers have anything more to buy.
Because the result depends on several teams, agree who owns each part. Marketing shapes which customers you win. Sales sets expectations at the start. Customer success manages health and renewals. Revenue operations connects the data so every team reads the same number and the company's ability to act on it improves.
Why net revenue retention matters for sustainable growth
NRR tells you about the stability of your revenue and the financial health of the business. A company with strong retention builds on a base that already exists. A company with weak retention has to replace lost revenue before it can grow.
It belongs in every revenue review. It also links to customer acquisition: when existing customers expand, you get more revenue without the cost of winning a new account.
It connects to customer lifetime value too. Customer lifetime value rises when a customer stays longer and buys more, and NRR shows that pattern across your whole customer base. Your business model and pricing decide how fast it can move, so treat NRR as one input to your retention strategies, not the only one.
What you gain when this is done properly
When net revenue retention is measured on a fixed customer group and reviewed every month, each team gets something it does not have when the number is buried in total revenue.
Sales gains a cleaner forecast and warmer accounts
Sales can forecast existing-customer revenue separately from new business, so the forecast stops mixing two different motions. Expansion conversations start from accounts that already use the product, which gives sellers a proven starting point.
Marketing gains a clearer view of which customers are worth winning
When retention is tied back to customer segments, marketing can see which segments stay and grow and which leave. That shows where to aim acquisition effort, and it gives marketing real customer outcomes to build stories around.
Customer success gains a measure of its impact
The customer success team is judged on a number that reflects renewals and growth, not only satisfaction. Health signals, renewal dates and expansion opportunities can sit in one view, so the team can act before an account leaves.
Turn net revenue retention into a number you can act on
A retention rate only helps when it is calculated the same way every time, from data your teams trust. That takes connected systems: billing, product usage, support and the customer record all feeding one view.
Propello designs and builds connected go-to-market systems on HubSpot. If you cannot yet say what your net revenue retention is, or which accounts are about to expand or leave, an audit is the place to start.