
If your forecasts miss, your reports disagree and every new tool adds work instead of removing it, the problem is rarely effort. It is the stage your revenue operations have reached. This self-check is for CEOs, founders and revenue leaders at growing B2B companies who want to know where they stand and what to fix first.
A RevOps maturity model answers one question: how far along is your revenue engine, and what is the next stage? You will score six areas as low, medium or high, read your overall stage from the pattern, and leave with one gap to close first. It takes about an hour, less if you already know your numbers.
|
RevOps Maturity Model A RevOps maturity model describes the stages a company passes through as marketing, sales and customer success move from ad hoc effort to one connected, measured revenue system. |
How to run this self-check in about an hour
This framework works best when you score each area as it works today, not as it is planned. Low means the work is manual, personal or undefined. Medium means it is written down but applied unevenly. High means it is documented, connected and runs the same way every week.
The levels below are Propello's own guidance, built from how we review revenue operations. They are not a research benchmark, so use them to start a better conversation, not to compare yourself with other companies.
Ask the heads of sales, marketing and customer success to score on their own first, then compare. Where the scores differ, you have found a gap in shared understanding, and that is often worth more than the total. For a wider review of marketing alone, our marketing maturity assessment covers it in six areas.
What the stages of RevOps maturity look like
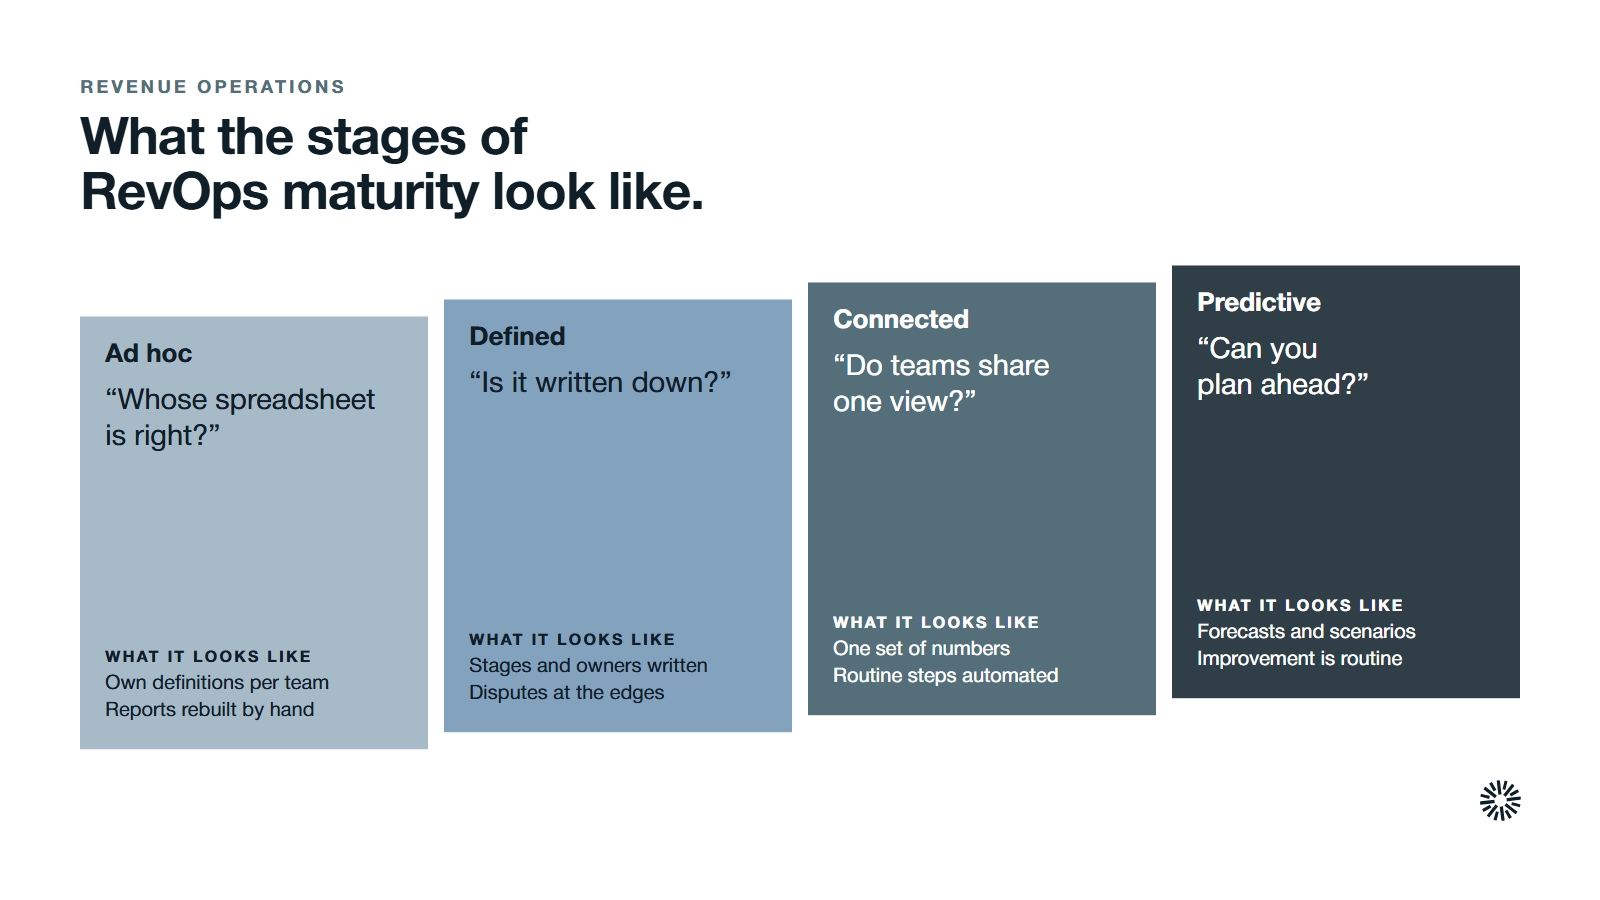
The RevOps maturity curve has four stages. Most companies sit across two of them at once, which is normal. The stage is a summary, so the area scores below matter more than the label.
- Ad hoc: Each team works from its own spreadsheet and its own definitions. Results depend on a few capable people, and reports are rebuilt by hand before every meeting.
- Defined: Stages, handoffs and ownership are written down, and the CRM mostly enforces them. Teams still argue at the edges, and reporting is reliable for some questions and not others.
- Connected: Marketing, sales and customer success share goals, one set of numbers and one view of the customer. Automation handles routine steps and exceptions are reviewed.
- Predictive: The system supports forecasting and scenario planning, not only reporting. Teams use data to decide where to invest next, and improvement is a standing routine.
More tools do not move a company up this curve. A company with many tools and no shared definitions is still ad hoc. If you want the wider picture of what the function is meant to do, start with our guide on what RevOps is.
What a RevOps maturity assessment evaluates
A good maturity assessment looks at four things together: people, processes, technology and data. It asks how well they line up across marketing, sales and customer success, because a strength in one with a weakness in another still leaves the revenue engine uneven.
Models differ on whether they count four or five stages, but the direction is the same: from siloed departments to a unified revenue engine. Early on, alignment is informal and depends on communication between a few people. A dedicated RevOps owner usually appears next, then a small team that manages the systems, and finally a function that uses predictive analytics to inform go-to-market strategy.
The value of the exercise is diagnostic clarity. It shows which bottleneck is costing the most, so you can prioritize improvements instead of fixing whatever is loudest. Higher maturity tends to improve forecasting accuracy and efficiency, because decisions rest on documented, measured processes.
Two habits show up at every step. First, keep one source of truth for revenue data, held in a central CRM with standardized lifecycle stages and common revenue metrics that every function uses. Second, treat the work as a cross-functional audit, not a review of one team.
Why revenue operations maturity changes revenue performance
Revenue operations maturity matters because it decides whether your growth depends on heroics or on a system. Mature RevOps organizations get the same result from the same inputs each month, which makes planning, hiring and spending far easier to defend.
A connected revenue engine also improves the customer experience. Buyers do not repeat themselves between teams, follow-up is timely, and customer behaviors such as product use and renewal signals reach the people who can act on them.
Over time that consistency becomes a competitive advantage. A company that sees its pipeline clearly can drive revenue growth by moving effort to the segments and channels that convert, while rivals still debate whose numbers are right. The same clarity supports sustained growth, because each improvement builds on the last one instead of being undone by the next reorganization.
Score your six areas as low, medium or high
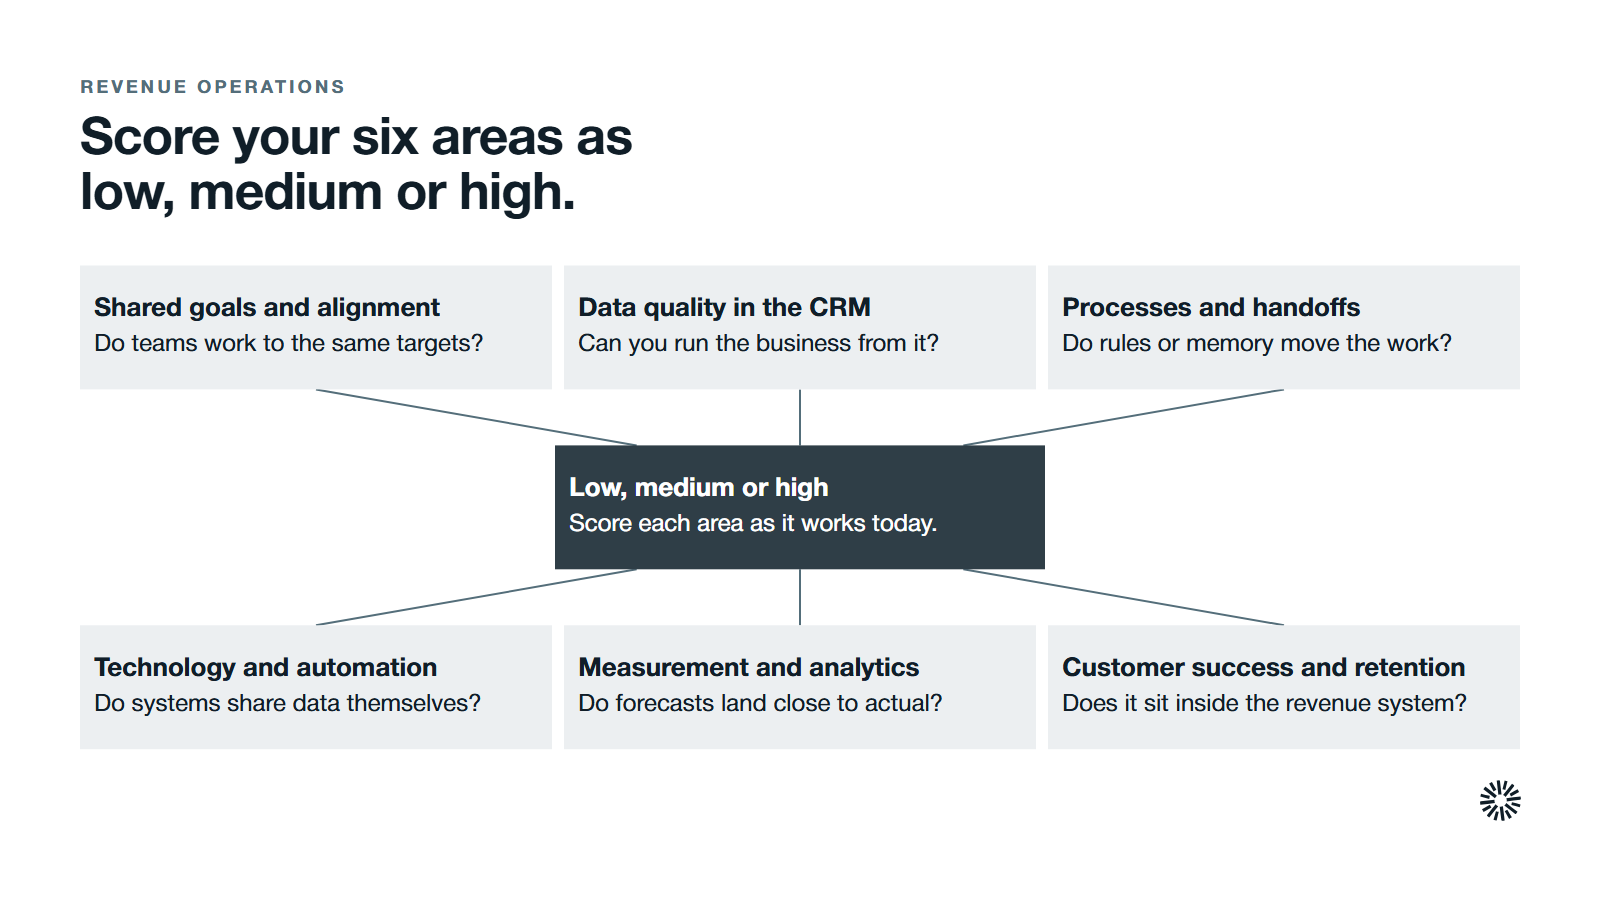
For each area, read the questions, pick the level that matches your week, and write down the score. Be honest, because a flattering score only delays the fix.
Shared goals and cross-functional alignment
This area covers whether sales, marketing and customer success work toward the same targets, in the same language. Without team alignment, every other fix pulls in a different direction.
HubSpot's 2026 State of Marketing report found that 27.6% of more than 1,500 marketers named sales-marketing alignment among their top challenges.
Ask yourself:
- Do all teams use one written definition of an ideal customer and of a qualified lead?
- Do marketing, sales and customer success share revenue goals, or does each have its own scoreboard?
- Do lifecycle stage names mean the same thing in every meeting?
Score it:
- Low: Teams work in silos with conflicting definitions and targets.
- Medium: Some shared metrics exist, but priorities still conflict.
- High: One go-to-market plan, shared goals and a joint review of results.
Data quality in the CRM
This area asks whether your CRM data is complete and trusted enough to run the business from. If it is not, reports start arguments and forecasts slip.
Ask yourself:
- Which report is the source of truth for pipeline, and does everyone agree on it?
- Do key fields such as source, owner and lifecycle stage carry a value in nearly every record?
- Does reporting come from the CRM, or from spreadsheets that someone updates by hand?
Score it:
- Low: Records are duplicated or incomplete, and reports are rebuilt by hand.
- Medium: Core fields are governed and some reports are trusted, but gaps remain.
- High: Key fields have owners, checks catch drift early, and people act on the reports.
Processes and handoffs
This area looks at how leads, deals and renewals move between teams. Mature teams have rules for lead routing, follow-up and handover, and they log activities where the next person can see them.
Salesforce's 2026 State of Sales report, a survey of 4,050 sales professionals, found that the average seller spends 40% of their time selling. The rest goes to work that clear processes and automation can reduce.
Ask yourself:
- Does every new lead have an owner and a response rule, whoever is online?
- Is the handover from marketing to sales, and from sales to customer success, written down?
- Do pipeline stages have entry and exit rules?
Score it:
- Low: Handoffs depend on who remembers, and leads wait in queues.
- Medium: Routing and stages are defined, with frequent workarounds.
- High: Handoffs run on rules, exceptions are reviewed and every stage has an owner.
Technology and automation
This area measures whether your systems work together or just coexist. The aim is not more tools but fewer manual steps between them.
Ask yourself:
- Do your main systems share data automatically, or do people copy it between them?
- Are routine tasks such as routing, reminders and updates automated?
- Does anyone own the stack and decide what gets added or retired?
Score it:
- Low: Tools were added one at a time, and people connect them by hand.
- Medium: Core systems are integrated, with manual steps at the edges.
- High: Systems share one customer record, and an owner governs changes.
Measurement and predictive analytics
This area covers how well you can see what is happening and what comes next. It runs from basic reporting through to predictive analytics and scenario planning.
Ask yourself:
- Can you see conversion rates between stages without building a report?
- Does your forecast land close to actual results, and do you know why when it does not?
- Do dashboards lead to decisions, or are they looked at and left?
Score it:
- Low: Reports describe the past and take days to assemble.
- Medium: Core metrics are tracked, but forecasts still miss.
- High: Forecasts are dependable, you test scenarios, and insights change where you spend.
Customer success and retention
This area asks whether customer success teams sit inside the revenue system or beside it. Retention and expansion feed revenue growth, so they need the same data and rules as new business.
Ask yourself:
- Do customer success teams see what was promised and who the buyers were?
- Do renewal and expansion signals reach the account owner in time to act?
- Are retention numbers reported next to new-business numbers?
Score it:
- Low: Customer success works from its own list and a separate scoreboard.
- Medium: Some data is shared, and renewals are tracked but reviewed late.
- High: Customer success shares goals, data and handoffs with sales and marketing.
Read your scores and find your stage
Count your lows, mediums and highs. The pattern points to a stage, and each stage has a different next move. These readings are Propello's guidance, not a benchmark.
- Mostly low, ad hoc: Do not buy anything yet. Write down definitions, name an owner for each handoff and agree one report that everyone accepts.
- Mostly medium, defined: The foundations exist, so connect them. Close the workarounds, fix the data fields that cause disputes and bring customer success into the same process.
- Mostly high, connected: Tune what works. Add forecasting, test scenarios and build a routine of continuous improvement, so the model keeps pace as you grow.
- High across all six, predictive: Protect the operating model. Review it twice a year and keep new tools from breaking the shared record.
A total hides detail. Two companies can both score mostly medium and need opposite fixes, so always read the six area scores, not only the stage.
Fix the deepest gap first
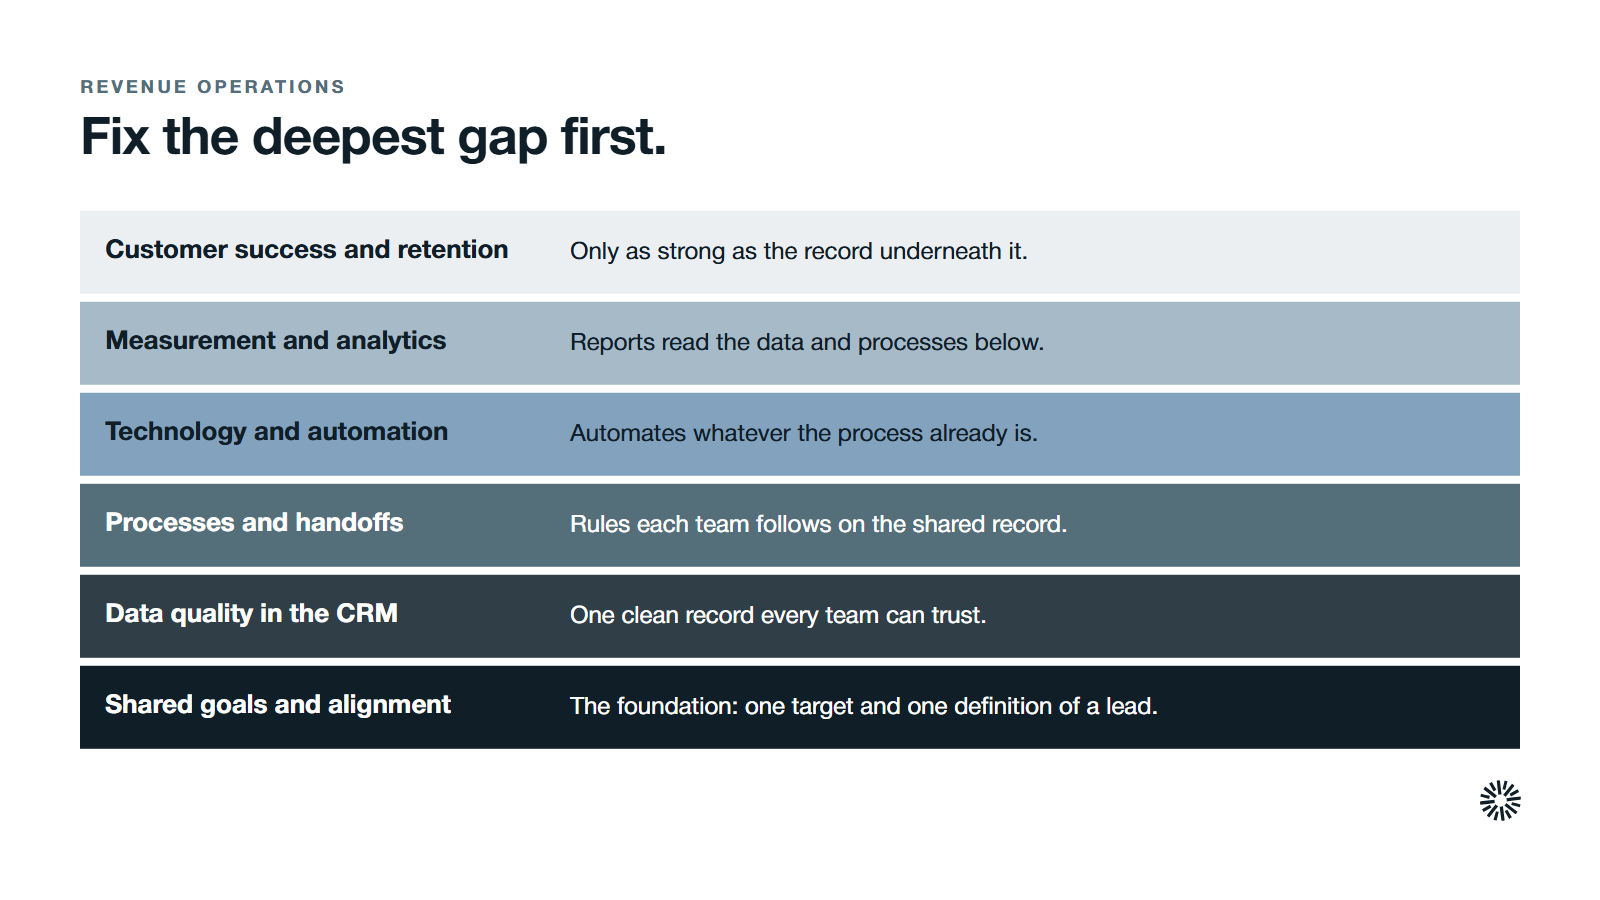
Look for the lowest score among the first two areas. Shared goals and CRM data sit underneath the other four, so a weak score there holds back processes, automation, forecasting and customer success. Fixing a downstream area first rarely moves revenue, because the work lands on a weak base.
Choose one gap for the quarter. Name an owner, write down what done looks like and set a date to score again. A short cycle of score, fix and rescore is what turns a self-check into sustainable growth.
If your scores point to a structural problem, our revenue engine scorecard rates five pillars of the go-to-market system and is a good second pass.
Build a roadmap to the next stage
Once you know your current state, turn the lowest score into a roadmap with three parts: what to define, what to connect and what to measure. Keep it to one quarter at a time, so the team sees progress and keeps momentum.
For most GTM teams the order is the same. Agree the shared language first, then clean the CRM data, then fix the revops processes that move work between teams, and only then add automation and reporting on top. Better data makes every later step cheaper, and a team-specific fix that ignores the shared record tends to be undone within months.
Measure the roadmap with a few visible numbers: conversion rates between stages, the time a lead waits for a first response, forecast accuracy and the share of records with every key field filled. Dashboards that show those four give leaders the visibility to see whether the work is paying off and actionable insights about what to do next. That is what makes the model data driven in practice, not only in name.
What you gain when this is done properly
Moving up the curve does not mean more process for its own sake. It means a revenue engine that behaves the same way each week, which gives each team something concrete.
Sales spends its time with buyers
Clean routing, clear stages and forecasts that hold up mean less time arguing about the pipeline report and more time on conversations that can close.
Marketing sees what happens to its leads
With shared definitions, marketing learns which campaigns produce pipeline and which produce noise. Budget moves toward what works, and valuable leads are no longer lost between systems.
Customer success starts with the full story
Customer success inherits the record of what was promised and who the buyers were. That supports onboarding, renewals and expansion, and customers stop repeating themselves at every handoff.
Turn your self-check into a plan with Propello
A self-check shows where the engine is weak. Turning it into a plan takes an outside view of strategy, data and systems together.
Propello is a HubSpot partner that designs and builds connected go-to-market systems and revenue operations on HubSpot. If your scores point to structural gaps, an audit is the place to start.
